
In 2025, High Yield spreads appear calm, perhaps too calm. The Bloomberg US Corporate High Yield OAS remains around 3.45%, a level that historically signals market optimism and relative credit health. Looking at High Yield OAS across the last two decades, it becomes clear that today’s spreads are unusually tight given the macro uncertainty and rising refinancing risk. The market may not be pricing credit risk accurately, or at least not in the way it used to.
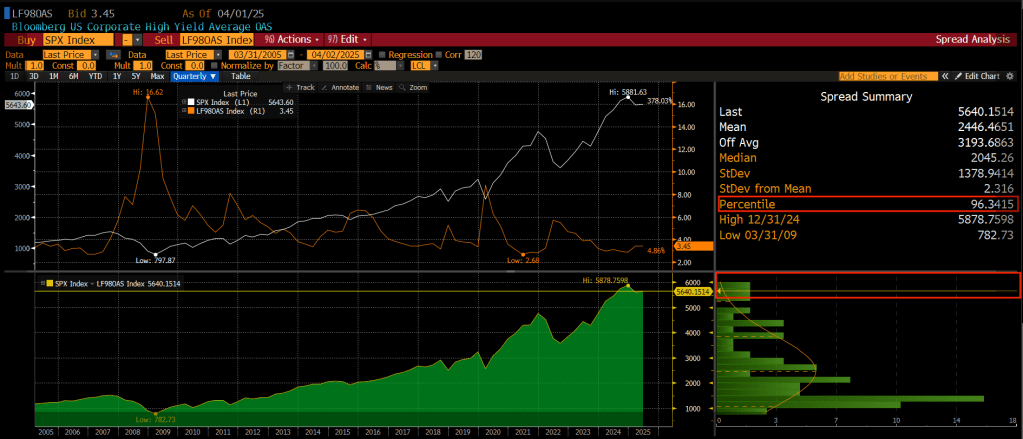
Bloomberg US Corporate High Yield OAS Index, 2005-2025 (source: Bloomberg Terminal as of 02.04.2025)
Spreads in Context
The chart above shows the Bloomberg US High Yield OAS (orange line, right axis) plotted against the S&P 500 (white line, left axis) from 2005 to 2025. Several key episodes stand out:
- In 2008–2009, spreads spiked above 16% during the Global Financial Crisis.
- In 2020, COVID-driven market stress pushed spreads near 9%.
- By contrast, the 2025 spread level of 3.45% places current situation in the 96th percentile of the SPX-HY OAS relative spread distribution (i.e only 4% of historical OAS values have been tighter (lower) than current ones).
Spreads this tight typically signal extremely strong market confidence. The reading tells us that current tight spreads are not aligned with typical cycle dynamics, especially when compared to previous market downturns or periods of elevated uncertainty.
The “Hidden” Risks
While the macro scenario in 2025 is shaped by moderating inflation and a Fed closed to policy neutrality, several underlying credit risks remain unresolved:
- Rising corporate leverage: During these past years, many high yield issuers have taken advantage of low interest rates to issue more debt. Instead of improving their balance sheets, a large portion of this borrowing went toward share buybacks and aquisitions. As a result, leverage ratios as Debt-to-EBITDA have spiked (particularly among B and CCC-rated issuers).1
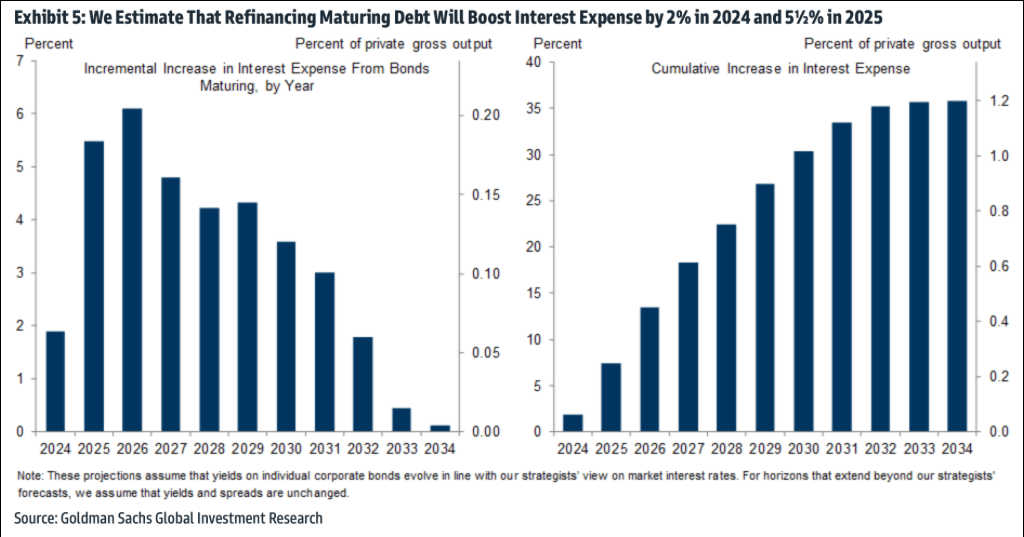
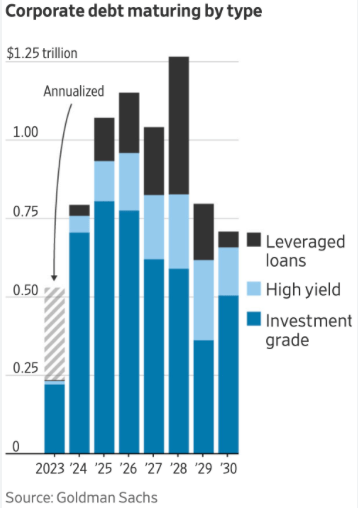
- A wave of upcoming maturities: According to BlackRock’s Global Credit Outlook Q1 2025 2 while credit fundamentals are stable, tight spreads and elevated valuations offer little cushion in the face of refinancing and macro risks. The research highlights the approaching maturity wall for high yield issuers and urges a pivot toward active, security-level credit selection.
- Sector-specific weakness:
- Commercial real estate continues to struggle under the weight of higher financing costs, falling property values, and lower office demand post-COVID.
- Consumer cyclicals face margin pressure from wage growth, elevated input costs, and softening discretionary demand.
- High-growth tech, some companies are seeing valuations reduce and face decreasing cash reserves. For these firms, refinancing may not just be expensive, but almost inaccesible, with restructuring as the main choice.
Signals Beneath the Surface
The green area in the chart depicts the difference between SPX Index (risk appetite) and OAS Index (perceived credit risk). When the SPX rises and the OAS falls, the spread widens, and the green area grows. In 2025, this spread has nearly reached its all-time highs, suggesting investors are pricing in little to no credit risk relative to equity valuations.
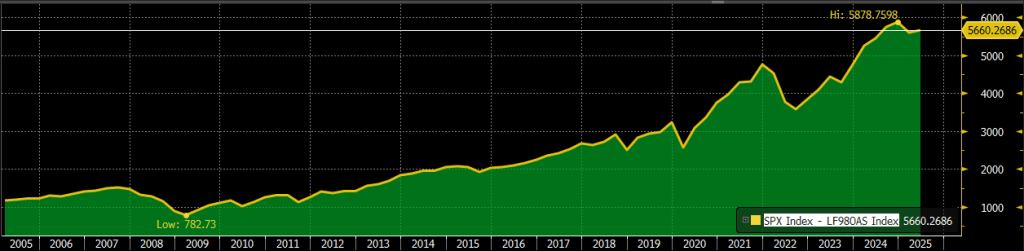
SPX Index – OAS Index, 2005-2025 (source: Bloomberg Terminal as of 02.04.2025)
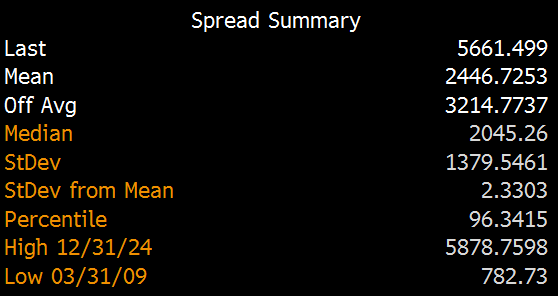
The distortion becomes evident when analyzing the Spread Summary (table below @ 02/04/2025) with the mean OAS value (~2446 bps) and median (~2045 bps) over the 20-year period . With a current reading of 3.45%, spreads are over two standard deviations tighter than average3, a historically rare occurrence outside of major bull market peaks.
Barbell Strategy – Positioning to Capitalize on Risk Mispricing
With high yield spreads near historic tights and structural risks accumulating below the surface, 2025 demands more than passive exposure. Instead, this scenario could call por precision allocation, and a Barbell Strategy provides a suitable framework to manage risk while seeking income.
A Barbell strategy allocates capital to the two extremes of the risk spectrum:
- Short-duration High-Yield = Income and limited exposure to long-term risk
- Long-duration high-quality Investment Grade = Positive Convexity (Because high-quality, long-term bonds are more sensitive to interest rate changes, they tend to rise sharply in price when yields fall, especially during market stress)
By combining both, investors create a “collar” with upside exposure to the HY yield and downside protection from convexity.
Conclusion: Risk Isn’t Gone, It’s Just Hidden
In 2025 YTD, High Yield OAS tells a story of stability, but not necessarily of safety. Rising leverage, refinancing pressure, and sector-level stress are quietly building beneath the surface.
The disconnection between equity appetite and credit complacency shows a signal not of resilience, but of mispricing, a market comforted more by liquidity and flows than by fundamentals.
In credit markets, the quietest signals often matter the most, and in 2025 the stillness of spreads may be covering a storm ahead.
Daniel Rivas


Leave a comment