
As volatility spiked on March 2025 after a stable beginning of the year, traders, portfolio managers and institutions turned to the widely common tools for hedging: Options on the SP500 (SPX) and the CBOE Volatility Index (VIX). Though both products aim to offer protection in turbulent scenarios, they behave very differently, and the main reason lies in convexity. In this post I analyze how convexity drove the divergent performance between SPX and VIX options during 2025 YTD key stress events.
2025 YTD Timeline
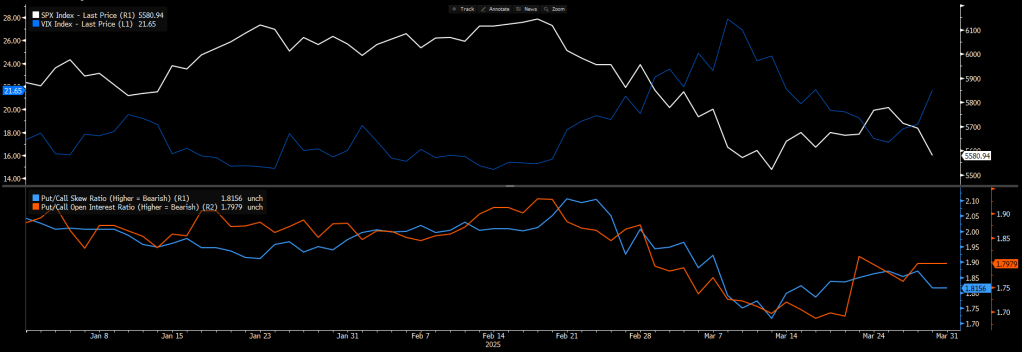
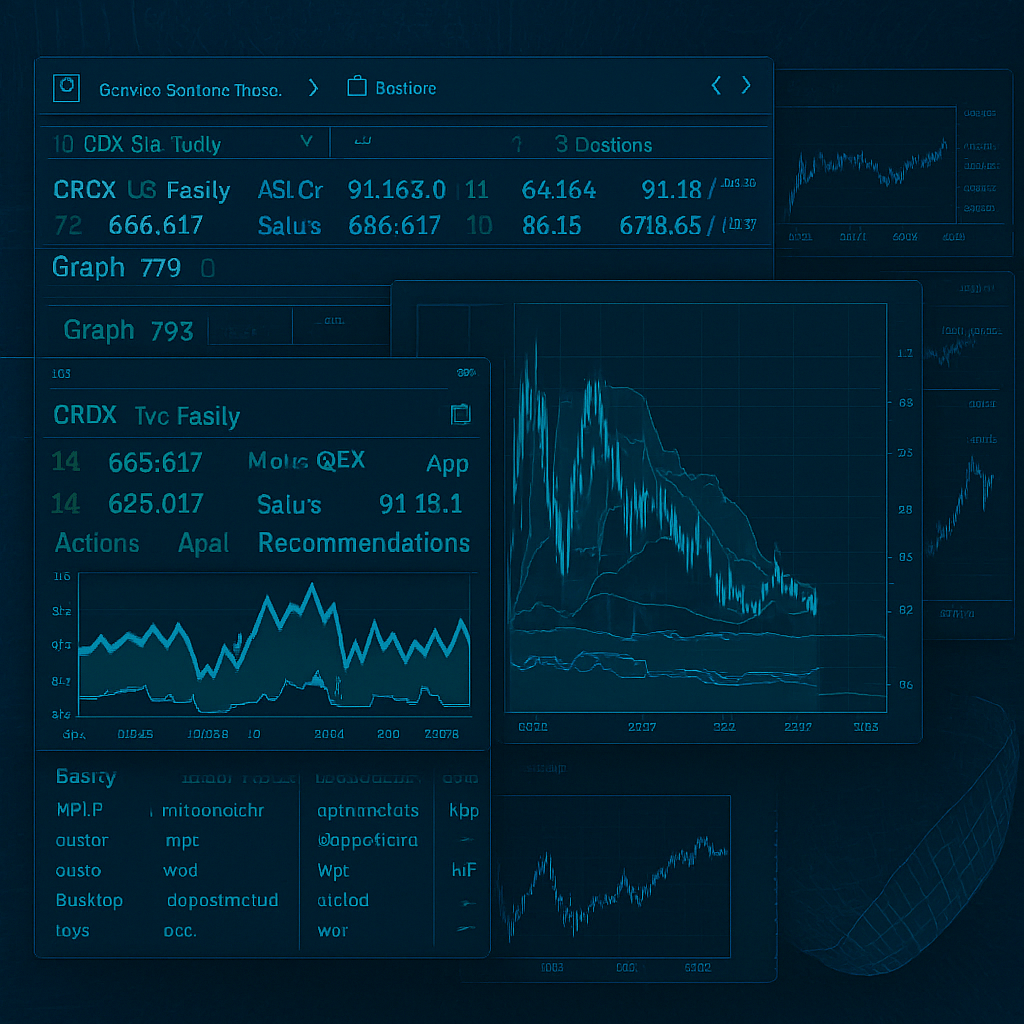
Top: SPX vs VIX 2025 YTD // Bottom: Put-Call Skew Ratio vs Put-Call Open Interest Ratio 2025 YTD (source: Bloomberg)
January to Mid- February (Stable beginning): SPX gain over 2,5% during he first month of the year, with the VIX in the range of the mid-teens. Implied volatilities were low (≈14–16% for 1-month SPX options) reflecting investor confidence, which translated into an all-time high on 19/02 (≈+4,5% YTD). Late February (Initial shakes): Rising fears related to U.S tariffs and economic uncertainty impacted markets. The SPX tumbled nearly 10%, officially approaching a correction ( further reading: “What is a market correction?” by Fidelity). Mid-March: Volatility spiked dramatically, VIX doubled within a month and SPX dropped to its lowest level YTD. Most panickying days, VIX´s raise outpaced SPX´s loss (i.e Convexity: a modest drop in equities yielded a dispproportionally volatility surge, which also reflects the positively skewed distribution of VIX). Late- March: as tariffs softened, equities rebounded and VIX retreated, but not before exposing which one performed best during the storm.
Understanding Put/Call Skew Ratio
Put/Call Skew Ratio is used as a comparative metric between Implied volatilities of OTM Puts and OTM Calls to gauge market pricing.
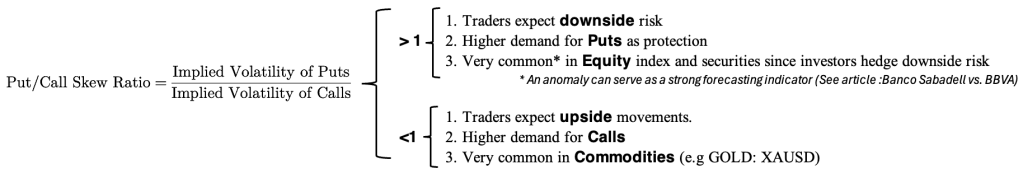
The Put/Call Skew Ratio increased significantly in February and March 2025. This steepening of the skew indicated that market participants were increasingly willing to pay a premium for downside protection, even as the market corrected. The skew rising above its historical average (e.g., skew ratios >1.3 or higher in some tenors) suggested elevated fear of tail risk, even more than what was visible in the headline VIX level.
Understanding Put/Call Interest Ratio
The Put/Call Interest Ratio measures the quantity of outstanding Put contracts relative to Call contracts. This metric does not rely on implied volatility, but on trader positioning.
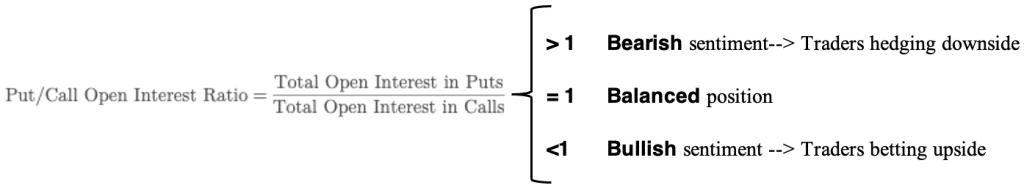
On February 19, the ratio dropped sharply (indicating more call positions open), while the skew ratio rose. This divergence suggested that retail or short-term traders were still positioned for upside, while institutional investors were increasingly hedging or preparing for a tail risk event. As the market began to decline, the Put/Call Open Interest Ratio spiked above 1.2–1.3, signaling a broad shift toward protection and a bearish repositioning. Historically, such increases in the ratio have correlated with local bottoms — as excessive put activity can signal peak fear and the potential for a reversal.
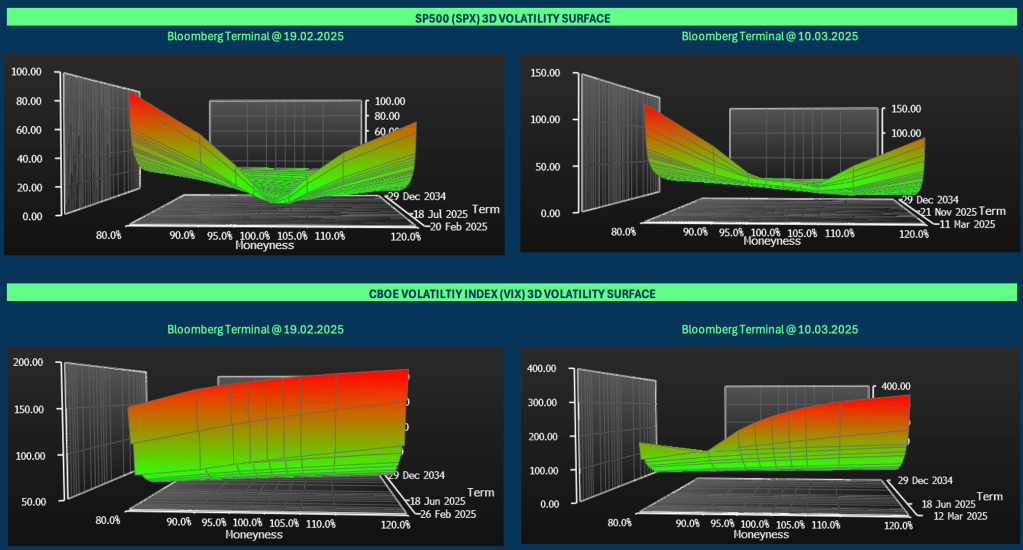
Convexity: SPX vs. VIX
Convexity, in option terms, refers to the nonlinear relationship between an option´s price and its underlying variable. It is often associated with Gamma (i.e sensitivity of delta to changes in the underlying).
- VIX´s convex relationship to SPX:
- By definition (and construction), VIX is a 30-day forward-looking volatility measure of the SPX.
- When equity market drops, investors buy protective puts, which derives in a more pronounced Volatility Skewness, a >1 Put-Call Skew Ratio and a >1 Put-Call Open Interest Ratio. This put-tilt drives up it´s price and hence, it´s implied volatilities.
- Markets are asymmetrically sensitive to downside (i.e investors are more afraid of losses than thrilled about gains) so the more uncertainty about the future, the larger the demand for protection which leads to an upward move in option prices and higher implied volatility, driving a VIX rise. As VIX moves upward, and since it is considered an indicator to gauge fear in the market, uncertainty spike and the vicious circle start again.
- VIX represents the square root of the market´s expected variance over the next 30 days derived from SPX options prices. Following the CBOE construction formula (link), VIX is calculated from OTM SPX options, both calls and puts, weighted by their contribution to expected variance. This structure, plus the inherent convexity of option prices to volatility makes VIX very responsive to sudden demand for protection.
- SPX Option Convexity:
- An SPX Put has a convex payoff in the underlying price (as Price<Strike, payout grows at an increasing rate, which is quantified by the option´s gamma). During the 2025 stress events, SPX puts had positive gamma: as SPX fell, Put´s Delta increased. Combined it with an increase in Vega, SPX Puts had a double convexity effect.
- Unlike VIX, SPX does not have an unbounded upside, in fact, the right tail is capped (in terms of Volatility and Convexity) which translates into a very limited speed and magnitude of SPX upside moves: Volatility rise sharply during selloffs but stay low or even fall during rallies, as Doran and Krieger (2020) note, “a 1% fall in the S&P 500 has a minimum of a 3.247% greater change in VIX, depending on VIX level, than when it rises” (p. 706)
Portfolio Management: SPX vs. VIX
- SPX puts are direct hedges against market declines. SPX puts are predictable, have linear payoffs once in the money, and provide protection as the index falls. However, they are expensive due to high demand and skew.
- Ideal for:
- Hedging expected corrections
- Systematic volatility overlays
- Tactic: Use short-dated ATM or slightly OTM puts for responsive delta protection.
- VIX calls are convex hedges against volatility spikes — especially effective when fear escalates rapidly. VIX options are cheap in calm regimes, but their payoff can be explosive when volatility spikes. They’re indirect, meaning they work best in fast, sharp stress events (crises, war, surprise inflation, etc.).
- Tactic:
- OTM VIX call spreads (e.g., 25–35 strike) can deliver 5–10x return in a crash.
- Use small notional size for efficient tail-risk hedging
Layered Hedging: SPX vs. VIX
Don’t rely on a single instrument — SPX puts and VIX calls hedge different dimensions of risk.
Their combined convexity provides diversified protection across both price and volatility regimes.
In 2025-like market conditions — with nonlinear moves and sudden shocks — the asymmetric payoff of VIX calls complements the reliable delta hedge of SPX puts.
Conclusion
The first few months of 2025 have offered a stark reminder of how convexity shapes outcomes in turbulent markets. While SPX options exhibited relatively muted returns despite increased realized volatility, VIX options delivered outsized performance, a direct result of their inherent convex profile and the explosive nature of volatility spikes. This divergence underscores the importance of understanding not just the direction of volatility, but its nonlinear effects on option payoffs.
For investors and traders, these dynamics highlight a broader lesson: in regimes of market stress, exposure to instruments with high convexity—like VIX calls—can serve as effective tail risk hedges, whereas linear or mildly convex exposures may underdeliver when protection is needed most. Going forward, as macro uncertainty and rate volatility continue to inject fragility into global markets, convexity-aware positioning may prove to be a critical edge in navigating the storm.
Daniel Rivas

Leave a comment