
For most of 2026, the US high-yield market looked untroubled. The ICE BofA US High Yield Index option-adjusted spread (OAS), i.e. the extra yield investors demand over Treasuries after adjusting for embedded call options, spent the summer in a narrow band and touched its year-to-date low of 260bp on 28 August. Then the Federal Reserve raised rates.
On 16 September the FOMC lifted the federal funds target range by 25bp to 3.75%–4.00%, in a unanimous 12–0 vote, stating that inflation “remains elevated.” By 22 October the high-yield spread had widened to 340bp, an 80bp move in under two months. The headline number, however, hides the more important story: nearly all of the stress is sitting in the lowest-rated part of the market.
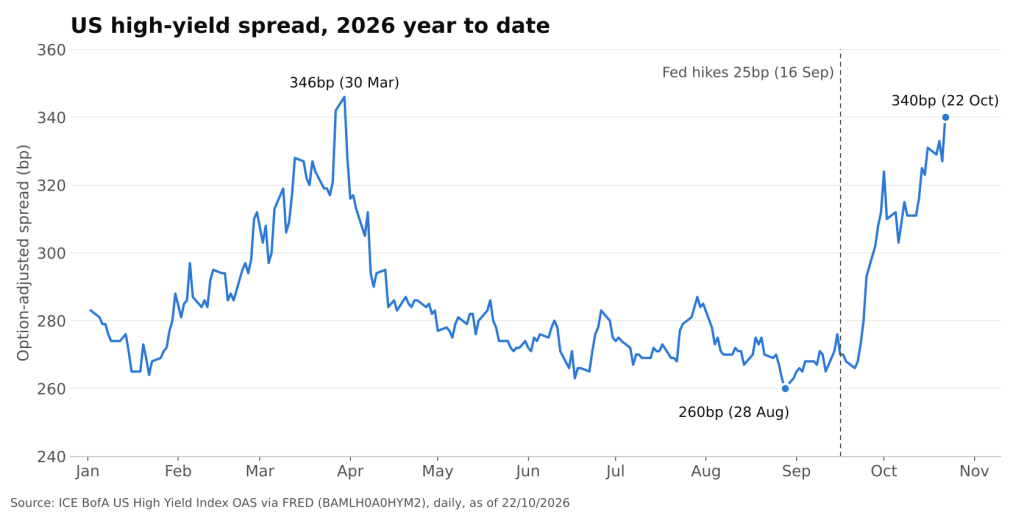
ICE BofA US High Yield Index OAS (FRED @ 22/10/2026)
A Headline Spread That Still Looks Contained
Taken on its own, 340bp is not a distressed reading. It sits below the 2026 high of 346bp reached on 30 March, and well below the 461bp printed on 7 April 2025 at the peak of the tariff shock. On that basis, a reader could conclude that credit markets are absorbing tighter policy in an orderly way.
The index level is an average across rating buckets, though. When the top of the rating spectrum stays tight, it can mask a very different picture in the tail. Splitting the market by rating shows exactly that.
The Quality Split: CCCs Break Away
Between 28 August and 22 October, spreads moved as follows across the ICE BofA rating indices:
- BB: from 150bp to 210bp, a 60bp widening, and still well inside the 306bp seen in April 2025.
- High Yield index: from 260bp to 340bp, an 80bp widening, also still below its April 2025 level.
- CCC & lower: from 1,026bp to 1,340bp, a 314bp widening, and now 203bp wider than at the April 2025 peak of 1,137bp.
In other words, CCC spreads have widened roughly five times as much as BB spreads since late August, and CCCs are the only bucket trading wider today than during the 2025 tariff sell-off. The 22 October CCC reading is also the widest in the three years of daily data published on FRED.
The year-to-date picture is even more lopsided. Since 31 December 2025, BB spreads have widened just 41bp and the overall index 59bp, while CCC spreads have widened 455bp, from 885bp to 1,340bp. Almost all of 2026’s credit repricing has happened in a single rating bucket.
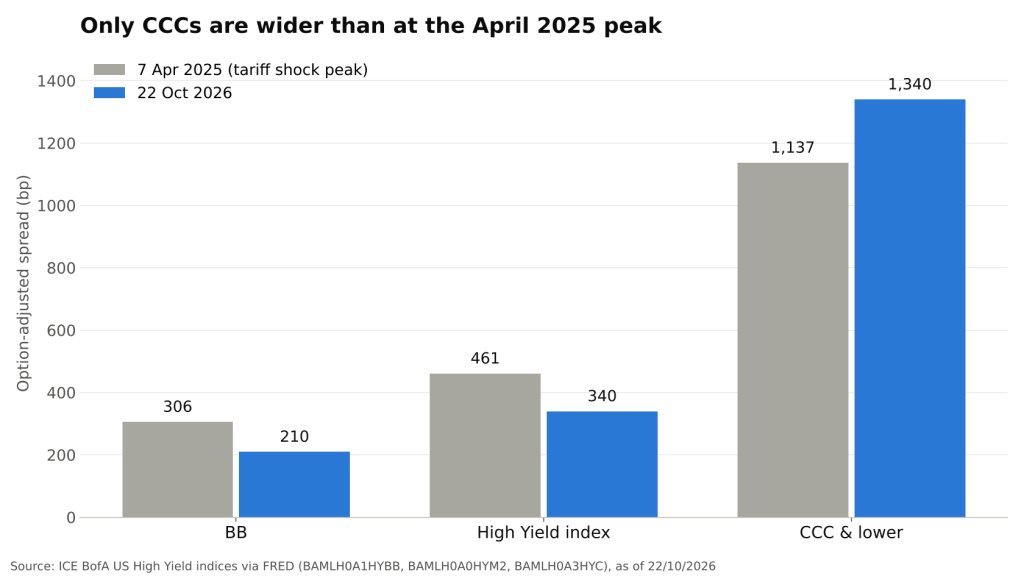
ICE BofA US HY OAS by rating, April 2025 peak vs today (FRED @ 22/10/2026)
The gap between the two ends of the market tells the same story. The CCC-minus-BB spread differential stood at 716bp at the end of 2025 and 831bp at the April 2025 peak. It is now 1,130bp. Investors are not repricing high yield as an asset class; they are repricing the weakest balance sheets within it.
Why Rate Hikes Hit the Tail First
The divergence is consistent with how tighter policy transmits through leveraged capital structures. Three mechanisms matter most:
- Refinancing arithmetic: CCC issuers typically have thin interest coverage (i.e. EBITDA relative to interest expense). A higher base rate raises the coupon they would pay to roll maturing debt, and for the most levered names that can turn a manageable maturity into a solvency question.
- Floating-rate exposure: many lower-rated borrowers also carry leveraged loans or private credit facilities, where coupons reset with short-term rates. A Fed hike flows into their cash interest bill almost immediately, while fixed-rate BB bonds feel it only at refinancing.
- Market access: when risk appetite tightens, primary markets close to the weakest credits first. Losing access to new issuance raises the probability of distressed exchanges and defaults, which spreads must then price.
The all-in cost of high-yield debt has risen on two fronts at once. The index effective yield climbed from 7.02% on 28 August to 8.14% on 22 October, a 112bp increase, of which spread widening accounts for 80bp and higher underlying Treasury yields for most of the remainder. The 10-year Treasury yield was above 5% in mid-October, at 5.15% on 19 October, before closing at 4.96% on 22 October.
What the Split Implies for Credit Positioning
A dispersion-driven widening carries different implications from a broad risk-off move:
- Index-level signals understate stress: a 340bp headline spread can coexist with a CCC segment pricing materially higher default expectations. Monitoring the CCC–BB differential gives earlier warning than the aggregate OAS.
- Security selection matters more than beta: when spreads decompress, returns are driven by which issuers can refinance, not by overall market direction. Interest coverage, maturity profile and liquidity runway become the key analytical inputs.
- Contagion risk is the swing factor: if CCC distress translates into higher realized defaults, the widening could spread into single-B and BB credits. So far, BB spreads remain well inside their April 2025 levels, suggesting the market still views the problem as idiosyncratic rather than systemic.
Conclusion
The Fed’s return to hiking has not produced a broad credit sell-off. It has produced a quality split. The high-yield index has widened 80bp but remains below its April 2025 peak, while CCC spreads have widened 314bp to their widest level in three years. The market is drawing a sharp line between issuers that can absorb higher funding costs and those that cannot.
The next test comes quickly. The FOMC announces its next decision on 28 October, with markets pricing a high probability of a hold, according to CME FedWatch data cited by Forbes, before the 9 December meeting. If policy keeps tightening, the key question is whether pressure stays confined to the CCC tail or begins to migrate up the rating spectrum. The CCC–BB differential is the gauge to watch.
Sources: ICE BofA US High Yield Index OAS, CCC & Lower OAS, BB OAS, HY Effective Yield and 10-Year Treasury (FRED); FOMC statement, 16 September 2026; Forbes, 19 October 2026.
Daniel Rivas



Leave a Reply