
For most of the past decade, Meta was the textbook example of a cash machine: an advertising franchise that converted a large share of revenue into free cash flow (FCF, i.e. operating cash flow minus capital spending) and returned much of it through buybacks. Its third-quarter 2026 results, released on 21 October, break that pattern. Revenue rose 26% year over year to $64.6bn, yet capital expenditures of $34.91bn exceeded operating cash flow of $32.79bn, leaving FCF at -$2.12bn.
The quarter matters beyond one company. It is the clearest case so far of a mega-cap platform whose AI build-out now consumes all of its internally generated cash, and it shifts the analytical question from “how much can it return to shareholders?” to “how is the investment being funded, and what does that do to the balance sheet?”
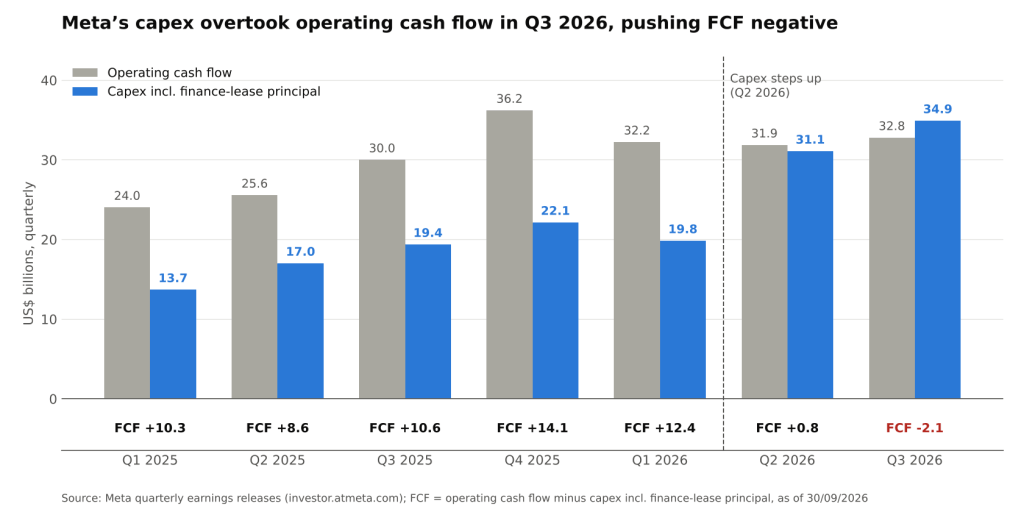
Meta quarterly operating cash flow vs. capex incl. finance-lease principal, US$bn (Meta earnings releases @ 30/09/2026)
The Crossover: Capex Outran a Growing Cash Engine
The negative print did not come from a weak operating business. Operating cash flow was $32.79bn in the quarter, up 9.3% from $30.0bn a year earlier. The swing came entirely from investment: capex, including principal payments on finance leases, rose 80% year over year from $19.37bn.
The step change happened in two moves. Through Q1 2026, capex absorbed a broadly stable 57–67% of operating cash flow each quarter, and FCF ran between $8.55bn and $14.08bn. In Q2 2026, capex jumped to $31.08bn (98% of operating cash flow), leaving FCF at just $0.78bn. Q3 pushed the ratio to 106%. Three metrics frame the shift:
- Capex intensity (capex as a share of revenue) rose from 37.8% in Q3 2025 to 54.0% in Q3 2026.
- FCF margin fell from 20.7% to -3.3% over the same period.
- Nine-month FCF for 2026 totals $11.05bn, against $29.5bn in the first nine months of 2025, and all of it was generated in Q1.
Guidance says the pressure has not peaked. Meta narrowed its 2026 capex range to $135–145bn, roughly double the $72.22bn spent in 2025. With $85.83bn spent through September, the range implies Q4 capex of roughly $49–59bn. Against the $73–76bn Q4 revenue guide, that equals roughly 65–81% of revenue, well above anything in the chart. Unless Q4 operating cash flow steps up sharply from the $31.9–36.2bn range of the last four quarters, a second and larger negative FCF quarter is the arithmetic base case.
Earnings Quality: Separating the Charge from the Trend
The income statement is noisier than the cash flow statement this quarter. Operating income fell 37% to $12.99bn and the operating margin halved to 20% from 40%. Most of that gap is a $9.89bn legal charge tied to an August 2026 agreement with 52 attorneys general over teen mental-health litigation. Excluding it, operating income was $22.88bn, a margin of about 35%. That is still five points below the year-ago level, as costs and expenses grew 68% against revenue growth of 26%.
Two points matter for cash-flow analysis:
- Accrual vs. cash. A charge recognized in the income statement is not necessarily paid in the same quarter. Meta puts total payments under the agreement at up to about $18.59bn, so part of the cash cost may still be ahead and would weigh on future operating cash flow rather than the Q3 figure.
- Depreciation lag. Capex spent today reaches the income statement only gradually, as depreciation over the assets’ useful lives. Margins can therefore keep compressing for years after the cash has gone out, even if the spending plateaus.
The second point is the more durable one. An investor who anchors on adjusted EPS ($7.40 excluding the charge, against reported $3.83) sees a business still growing earnings. One who anchors on FCF sees a business that, for now, is not generating any. Both are accurate; they measure different things.
The Balance Sheet: From Net Cash to Roughly Flat
With FCF near zero and dividends still being paid ($1.36bn in Q3), the investment has increasingly been funded on the liability side. Long-term debt rose from $58.75bn at end-March to $83.66bn at end-June, an increase of about $24.9bn in a single quarter, and stood at $80.92bn at 30 September.
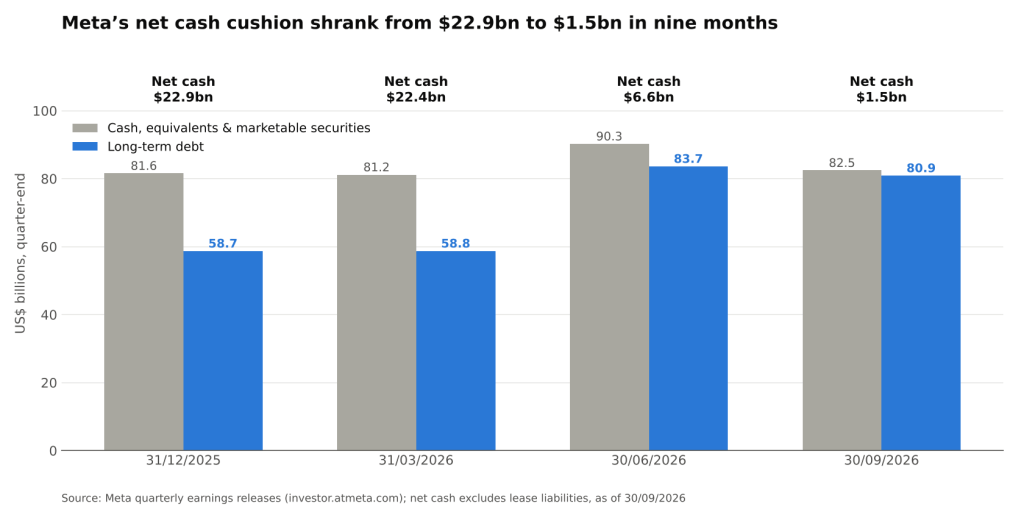
Meta cash, equivalents and marketable securities vs. long-term debt, US$bn (Meta earnings releases @ 30/09/2026)
Netting the two, Meta’s cash cushion fell from $22.85bn at end-2025 to $1.53bn at 30 September. This simple measure excludes lease liabilities, which can be material for a company building data centers, so on a broader definition the position is already one of modest net debt. For credit analysts, that changes the frame:
- Leverage is low in absolute terms. Annualized operating cash flow of more than $120bn against roughly $81bn of long-term debt is not a stretched profile. The issue is direction, not level.
- Capital returns have already adjusted. Meta repurchased no shares in Q1, Q2 or Q3 2026, after $26.26bn of buybacks in 2025. Buybacks are the first lever a company pulls when FCF disappears, and that lever has been pulled.
- Funding mix is the next variable. If Q4 capex lands in the implied range, the gap will have to be met by drawing down cash, more borrowing, or off-balance-sheet structures such as leases and joint ventures, each with different implications for bondholders and equity holders.
What This Means for Valuation
For valuation work, negative FCF does not by itself signal value destruction. It does, however, change which assumptions carry the weight:
- Return on invested capital. A DCF built on today’s cash flows is dominated by the terminal value, i.e. by the assumed return on the capital now being deployed. Whether AI infrastructure earns more than its cost of capital becomes the central input, and it is not yet observable in reported numbers.
- Maintenance vs. growth capex. Analysts who normalize FCF by treating part of capex as discretionary growth spending can show a very different picture from reported FCF. That judgment should be explicit, because data center hardware may need replacement on a shorter cycle than traditional infrastructure.
- Cost of capital. While Meta held net cash, debt played only a minor role in its WACC. As borrowing becomes a meaningful funding source, the capital structure, and therefore the discount rate, becomes a moving input rather than a constant.
Conclusion
Meta’s Q3 2026 results mark a transition from a cash-returning platform to a capital-intensive builder. The core business is still growing revenue at 26% and operating cash flow at high single digits, but capex at 106% of operating cash flow has turned FCF negative, kept buybacks on hold and nearly eliminated the net cash cushion within nine months.
The items to watch are Q4 capex against the implied $49–59bn, the timing of cash payments under the legal agreement, any new debt or lease-based financing, and the first 2027 capex framework. Together they will show whether negative FCF is a one- or two-quarter trough or a multi-year funding model.
Sources: Meta Q3 2026 results; Meta Q2 2026 results; Meta Q1 2026 results; Meta Q4 and full-year 2025 results; Meta Q3 2025 results (earlier 2025 quarterly releases at investor.atmeta.com).
Daniel Rivas



Leave a Reply