
With Brent crude at $115 a barrel (EIA spot, 20/10/2026) and the 10-year Treasury yield touching 5.31% on 5 October, the obvious reading of this year’s bond selloff is an inflation scare. The market’s own pricing says otherwise. Splitting nominal Treasury yields into their two observable parts, i.e. the real yield on Treasury Inflation-Protected Securities (TIPS) and the breakeven inflation rate (the gap between nominal and real yields), shows that almost the entire move has come from real rates.
That distinction matters now. The FOMC concludes its 27–28 October meeting today with the target range at 3.75–4.00%, PCE inflation data follows on 29 October, and the 22 October risk-off rally gave the first clean test in weeks of what bond investors are actually being paid for. The answer shapes how duration, TIPS, equity discount rates and credit all behave from here.
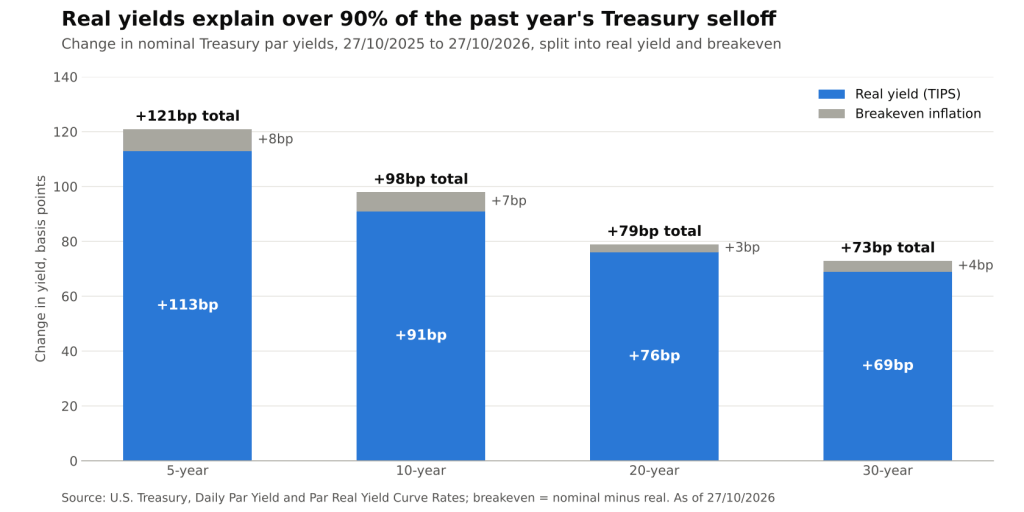
Change in Treasury par yields by maturity, split into real yield and breakeven, 27/10/2025 to 27/10/2026 (U.S. Treasury @ 27/10/2026)
The Decomposition: A Real-Rate Selloff
Using Treasury’s daily par nominal and par real yield curves, the change over the twelve months to 27 October breaks down as follows:
- 5-year: nominal yield up 121bp to 4.82%, of which 113bp came from the real yield (1.24% to 2.37%) and just 8bp from breakevens.
- 10-year: nominal yield up 98bp to 4.99%; the real yield rose 91bp to 2.64%, while the breakeven moved from 2.28% to 2.35%.
- 30-year: nominal yield up 73bp to 5.30%; the real yield rose 69bp to 3.05%, and the breakeven edged from 2.21% to 2.25%.
Across the curve, real yields explain 93–96% of the increase. Long-run inflation compensation is essentially where it was a year ago, despite triple-digit oil. Two caveats apply: breakevens embed an inflation risk premium and a TIPS liquidity premium, so they are not a pure forecast, and the par real curve is fitted from a thinner market than nominals. Neither caveat is large enough to overturn a split this lopsided.
What Sits Inside the Real Yield
A higher real yield is not one thing. It bundles the expected path of real policy rates with a term premium, i.e. the extra compensation investors demand for locking money up in long bonds rather than rolling short bills.
- Policy path. The 2-year yield, the cleanest market read on the next two years of Fed policy, rose 122bp to 4.70% over the year. With the funds rate at 3.75–4.00%, a 2-year yield of 4.70% implies a policy path averaging above the current range rather than one of cuts.
- Term premium. The Fed Board’s Kim-Wright model put the 10-year term premium at 1.06% on 13 October and 0.99% on 16 October. For historical context, that sits just below the low end of the range the same model shows for 1990 to mid-1996, when its estimate ran between roughly 1.07% and 2.52%.
- Curve shape. Because the front end rose more than the long end, the curve flattened over the year: the 2s10s spread narrowed from 53bp to 29bp, and 5s30s from 96bp to 48bp.
The term-premium reading is a model estimate rather than a market price, and different models disagree on its level. The direction, however, is consistent with the decomposition: investors are demanding more real compensation, not pricing a lasting loss of the inflation anchor.
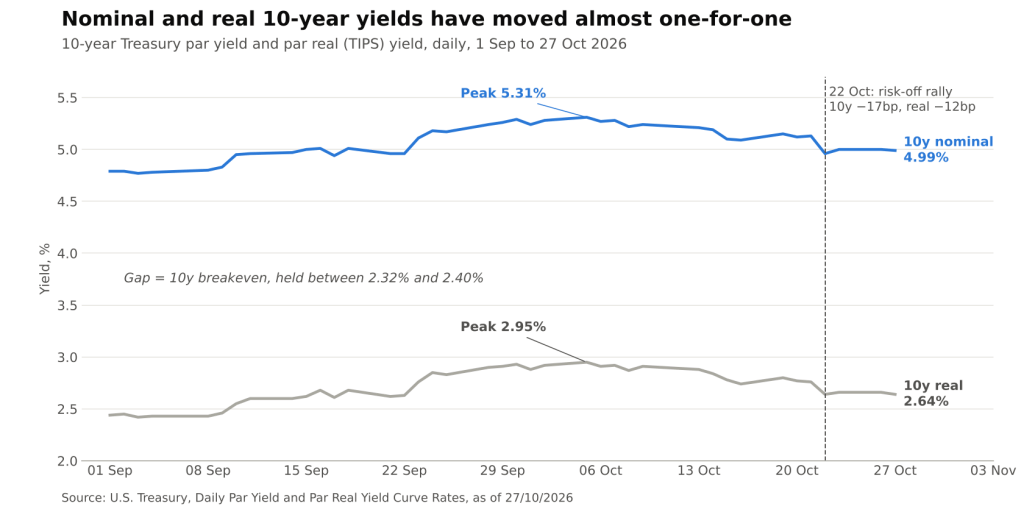
10-year Treasury par yield and par real yield, daily, 1 September to 27 October 2026 (U.S. Treasury @ 27/10/2026)
The 22 October Test
The September–October leg reinforces the point. From 1 September to the 5 October peak, the 10-year nominal yield rose 52bp and the 10-year real yield rose 51bp; the breakeven barely moved, staying between 2.32% and 2.40% throughout September and October.
Then came 22 October. As AI-linked equities sold off, with the Philadelphia semiconductor index down 6.7% and the Nasdaq Composite down 2.6% on the day, Treasuries rallied hard:
- 10-year: nominal yield down 17bp to 4.96%, its first close below 5% since 22 September; the real yield fell 12bp, so roughly 70% of the move was real.
- 5-year: the real yield fell 22bp while the nominal yield fell only 17bp, meaning the 5-year breakeven rose from 2.40% to 2.45%. Near-term inflation compensation climbed even as growth fears hit risk assets.
- 2-year: down 16bp to 4.65%, as the market trimmed the expected policy path.
That combination, falling real yields with sticky or rising near-term breakevens, is the signature of a growth scare layered on a supply-side price shock. From the 5 October peak to 27 October, the 10-year nominal yield has fallen 32bp, the real yield 31bp, and the breakeven just 1bp. The retreat, like the advance, has been a real-rate story.
Implications Across Asset Classes
- Duration as a hedge. Because the selloff was driven by real rates rather than inflation compensation, nominal Treasuries retained their ability to rally in a growth shock. A selloff driven by breakevens would have left less room for that hedge to work.
- TIPS versus nominals. With breakevens near 2.35% at 10 years, inflation protection is priced close to its level of a year ago. The relative value question is whether realized inflation from an oil shock of this size exceeds that hurdle, not whether real yields themselves are attractive.
- Equity discount rates. A 91bp rise in the 10-year real yield is a direct increase in the real discount rate applied to long-duration cash flows. That is a heavier headwind for long-dated growth equities than for businesses whose revenues reprice with inflation.
- Credit. All-in corporate yields inherit the real-rate move. For issuers refinancing, the cost increase is real rather than offset by higher nominal revenue growth, which raises the bar for interest coverage.
Conclusion
The headline narrative of oil-driven inflation fear does not survive a look at Treasury’s own curves. Over the past year, real yields account for more than 90% of the rise in nominal yields at every maturity from 5 to 30 years, while 10-year breakevens have barely moved from around 2.3%. The bond market is charging more for real money and for duration risk, not abandoning confidence in long-run inflation.
What to watch next: the FOMC statement and press conference today for guidance on the policy path, the 29 October PCE release for whether the oil shock is feeding into core prices, and above all the 5-year breakeven. If near-term inflation compensation keeps rising while real yields fall, the market is shifting from a real-rate problem to a stagflation one, and the hedging properties seen on 22 October would be harder to rely on.
Sources: U.S. Treasury, Daily Par Yield Curve Rates; U.S. Treasury, Daily Par Real Yield Curve Rates; Federal Reserve Board, Kim-Wright 10-Year Term Premium via FRED (THREEFYTP10); FRED, Federal Funds Target Range (DFEDTARU/DFEDTARL); EIA Brent spot via FRED (DCOILBRENTEU); 24/7 Wall St., 23 October 2026.
Daniel Panizo, CFA, FMVA


Leave a Reply