
US power markets have just come through a record stretch. The Lower 48 grid averaged 541 GW of load in September 2026, about 8.7% above the prior high set a year earlier, according to FactSet’s Q3 utilities preview. The EIA’s October Short-Term Energy Outlook expects average wholesale power prices of $52/MWh across 11 hubs in 2026, 11% above 2025, with PJM, i.e. the grid operator covering much of the Mid-Atlantic and Midwest, up 41%.
Yet the consumer price of electricity has barely moved for five months. The BLS electricity index peaked in May 2026 and sat 0.9% below that level in September, even as headline CPI accelerated. As utilities report Q3 results, that divergence is the more useful signal: it shows how much wholesale cost is still sitting inside the regulatory pipeline rather than on customer bills.
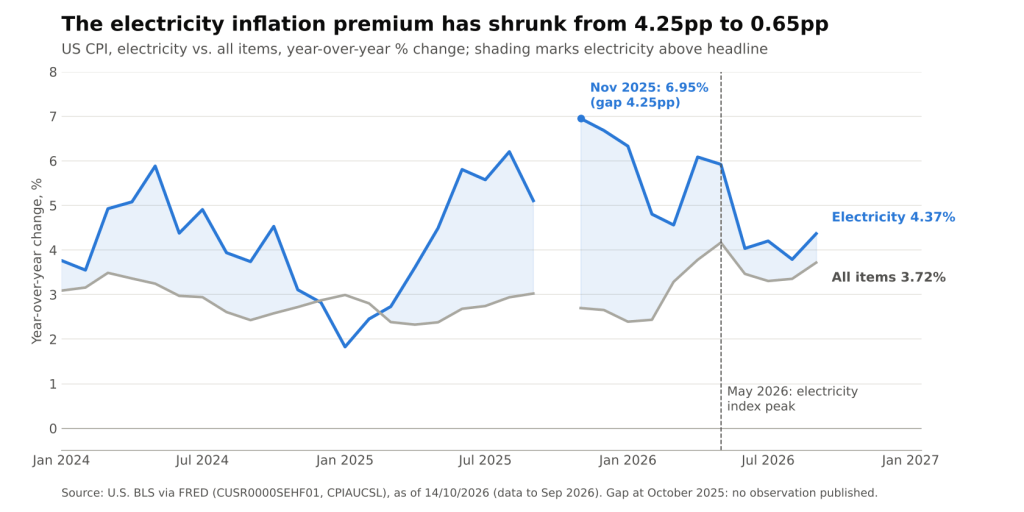
Electricity CPI vs. all-items CPI, year-over-year % change, January 2024 to September 2026 (U.S. BLS via FRED @ 14/10/2026)
A Premium That Has Almost Closed
Electricity has been a persistent source of above-headline inflation in the US basket. On a year-over-year basis, the electricity CPI ran ahead of headline CPI in 18 of the 20 monthly readings from January 2025 to September 2026 (October 2025 has no published observation). The premium peaked at 4.25 percentage points in November 2025, when electricity inflation reached 6.95% against 2.70% for all items.
By September 2026 that gap had compressed to 0.65pp: electricity at 4.37% year-over-year, headline at 3.72%. Two forces did the work, and they point in different directions:
- Headline caught up. All-items CPI rose at a 4.6% annualized pace from June to September, narrowing the gap from the other side as energy and fuel costs elsewhere in the basket rose.
- Electricity stalled. Over the same three months the electricity index rose at only a 0.7% annualized rate, despite the hottest September on record and double-digit wholesale gains.
The second point is the analytically interesting one. A flat retail index during a wholesale spike is not evidence that cost pressure has faded. It is evidence that the cost has not yet been passed through.
Why Retail Prices Lag Wholesale Prices
Most US households buy power at regulated tariffs, not at spot prices. Retail rates are reset through a sequence of administrative steps, each with its own delay:
- Fuel and purchased-power adjustment clauses. These pass energy costs through to customers, but typically with a true-up lag, i.e. under-recovered costs are booked as a regulatory asset and collected over subsequent months.
- Base rate cases. Returns on new transmission, distribution and generation investment enter bills only after a commission approves a rate case, a process that can take the better part of a year.
- Capacity costs. In organized markets such as PJM, capacity auction results feed into supply rates on a delivery-year schedule, so a price set today shows up on bills well after the auction clears.
- Political smoothing. Regulators facing affordability pressure can phase in increases or extend recovery periods, trading lower near-term bills for longer-dated receivables.
The EIA’s forecast embeds exactly this sequencing. It projects the average residential price rising from 17.3¢/kWh in 2025 to 18.2¢/kWh in 2026 (about +5.2%) and 18.7¢/kWh in 2027 (about +2.7%), even as average wholesale prices ease to $49/MWh in 2027 and PJM falls about 7%. Retail keeps climbing after wholesale peaks because the bill is a rolling average of past costs and past investment.
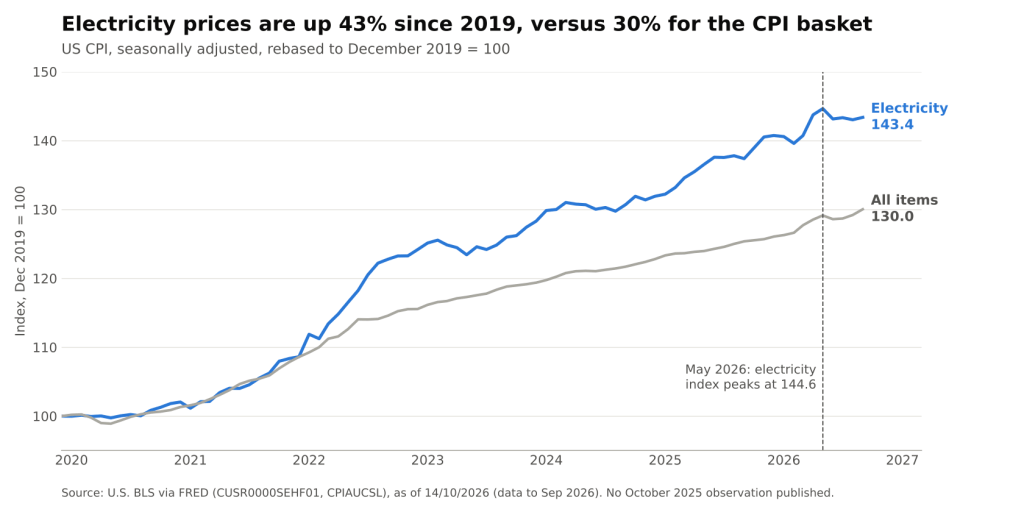
Electricity CPI vs. all-items CPI, rebased to December 2019 = 100 (U.S. BLS via FRED @ 14/10/2026)
The Cumulative Picture: Affordability as a Constraint
The near-term stall should not obscure the level shift. Since December 2019, the electricity CPI has risen 43.4%, against 30.0% for the overall basket. Households are therefore paying meaningfully more for power in real terms than before the pandemic, and that cumulative gap is what state commissions confront when utilities file for new rates.
This matters because demand growth is now structural rather than cyclical. The EIA expects total US electricity consumption to rise from 4,195 billion kWh in 2025 to 4,288 billion kWh in 2026 and 4,356 billion kWh in 2027, with commercial demand, the category that includes data centers, growing 2.8% in 2027. Serving that load requires generation and grid capex, and every dollar of capex eventually needs a rate base, i.e. an approved asset value on which the utility earns its allowed return.
The tension is already visible in policy. FactSet notes that the Texas governor ordered a pause on new data center approvals pending an audit of the state’s large-load interconnection queue. Cost allocation, i.e. who pays for grid upgrades driven by a handful of very large customers, is becoming the central regulatory question of the cycle.
Implications for Utility Credit and Earnings
For analysts, the lag between wholesale cost and retail recovery translates into several observable effects:
- Cash conversion. Under-recovered fuel and power costs sit on the balance sheet as regulatory assets. Earnings can look stable while operating cash flow weakens, which widens the gap between reported EPS and FFO-based credit metrics such as FFO/debt.
- Earned versus allowed returns. When costs rise faster than rates reset, utilities under-earn their authorized ROE until the next case. The longer the lag, the larger the drag, particularly when financing costs are also rising.
- Dispersion within the sector. FactSet’s consensus shows Q3 earnings growth of 14% for independent power producers but only 6% for regulated electric utilities, against 7.0% for the sector (down from 8.8% expected on June 30). Merchant generators capture wholesale prices directly; regulated utilities collect them later, and only to the extent commissions allow.
- Regulatory risk premium. The bigger the cumulative bill increase, the higher the political cost of the next one. Jurisdictions with formula rates, forward test years or timely trackers should see less earnings slippage than those relying on historical test years.
Conclusion
The narrowing of the electricity inflation premium, from 4.25pp in November 2025 to 0.65pp in September 2026, says more about timing than about relief. Load has set records, wholesale prices are up double digits, retail tariffs have paused, and the EIA still expects residential prices to rise through 2027. The cost is in the pipeline; the question is how fast regulators let it through.
What to watch next: the October CPI release for whether the electricity index resumes rising, commentary on deferred fuel balances and rate case calendars in Q3 utility earnings, and the EIA’s November 10 outlook for any revision to the 2027 residential price path. Large-load tariff decisions, starting with the Texas interconnection audit, will shape how the bill is split between data centers and households.
Sources: FRED, CPI: Electricity (CUSR0000SEHF01); FRED, CPI: All Items (CPIAUCSL); EIA, Short-Term Energy Outlook, October 2026; FactSet, S&P 500 Utilities Sector Earnings Preview Q3 2026; Reuters via WMBD, EIA demand forecast.
Daniel Panizo, CFA, FMVA


Leave a Reply