
The Federal Reserve held the federal funds target range at 3.75%–4.00% on 28 October, six weeks after delivering its first hike since 2023. The decision itself was expected; the vote was not entirely. Governor Lisa Cook and Cleveland Fed President Beth Hammack dissented in favor of another 25bp increase, turning September’s unanimous 12–0 into a 10–2 split. The statement, for its part, described inflation as still elevated and said the Committee would gather more information before setting the stance needed to return it to 2%.
The disagreement is less about the data than about which data to trust. September CPI showed headline inflation at 3.72% year over year but core inflation (i.e. excluding food and energy) at only 2.57%. A gap of 115bp between the two measures means the same policy rate can look tight or loose depending on the deflator chosen. That choice is now the fault line inside the FOMC.
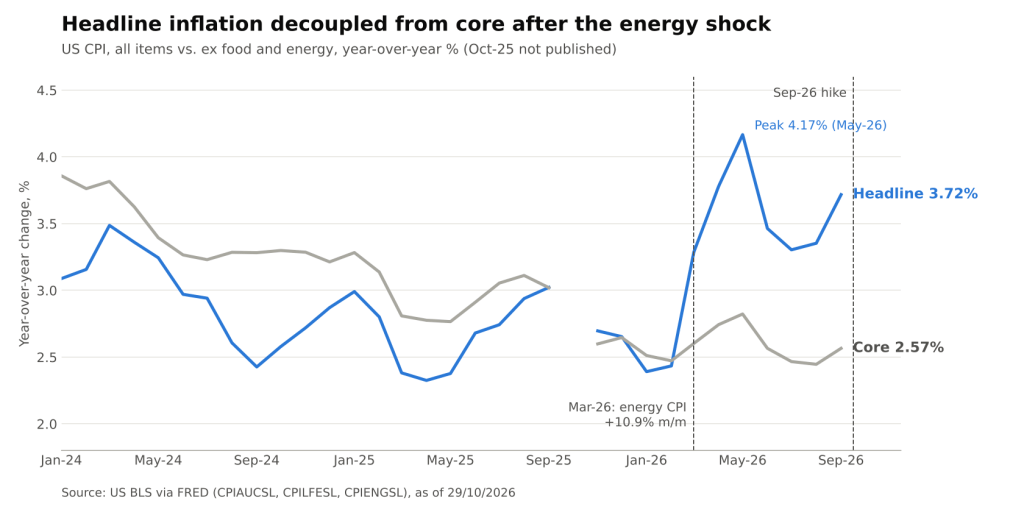
US headline vs. core CPI inflation, year over year (BLS via FRED, CPIAUCSL and CPILFESL @ 29/10/2026)
Anatomy of the Gap: An Energy Shock, Not a Broad Repricing
Until early 2026 the two series moved together. In February, headline CPI ran at 2.43% and core at 2.47%, essentially identical. Then the energy component jumped 10.9% in a single month in March, and by May headline inflation had peaked at 4.17% while core reached just 2.82%.
The divergence since February is stark:
- Headline CPI: up 129bp, from 2.43% to 3.72%.
- Core CPI: up only 10bp, from 2.47% to 2.57%.
- Energy CPI: up 20.4% year over year in September, after a renewed monthly rise.
- Monthly pace: headline rose 0.65% in September against 0.33% for core, so the latest print widened the gap again rather than narrowing it.
Read narrowly, this is a classic supply shock: a relative-price change that central banks are traditionally taught to look through. Read broadly, a 20% annual rise in energy costs is large enough, and persistent enough, to leak into wages, transport costs and inflation expectations. Both readings are defensible, which is exactly why the vote split.
The Real Policy Rate Depends on the Deflator
The cleanest way to see the disagreement is through the real policy rate, i.e. the nominal fed funds rate minus inflation. Using the monthly average effective rate from FRED, the picture changes completely depending on which CPI is subtracted.
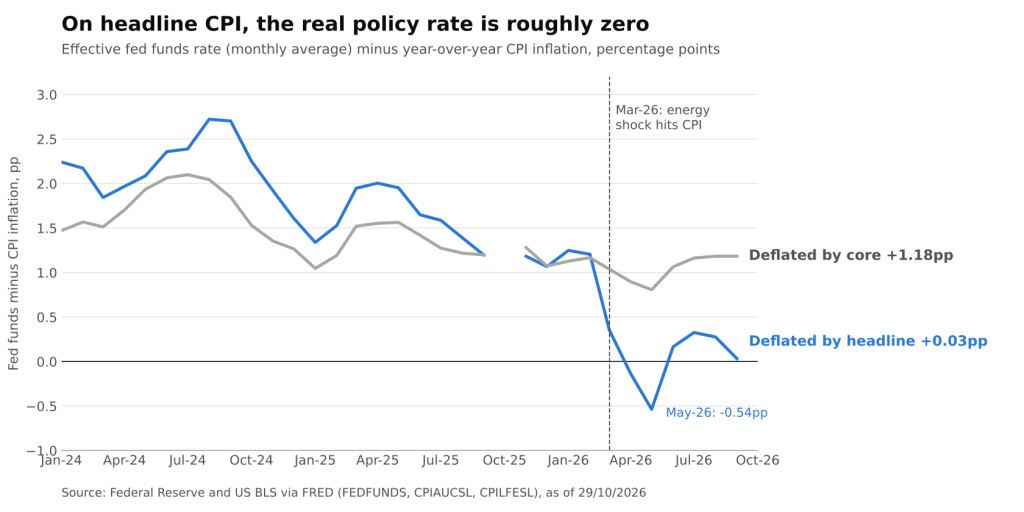
Effective fed funds rate minus CPI inflation, deflated by headline vs. core (Federal Reserve and BLS via FRED, FEDFUNDS, CPIAUCSL and CPILFESL @ 29/10/2026)
- Deflated by core: the real rate stood at roughly +1.18pp in September, close to where it has hovered since late 2025. On this view policy is already restrictive, and patience is warranted.
- Deflated by headline: the real rate was just +0.03pp, and it was negative in April and May, bottoming at -0.54pp. On this view the September hike merely brought policy back to neutral-to-zero in real terms, and further tightening is needed.
- Daily effective rate: the effective rate has since settled at 3.88% (as of 26/10/2026), which lifts both measures by about 13bp against September inflation but does not change the ranking.
The Fed’s preferred gauge narrows the gap but does not close it. In August, headline PCE inflation was 3.42% and core PCE was 3.01%, a spread of about 41bp. Notably, core PCE sits well above core CPI, which weakens the argument that underlying inflation is already back near target. The September PCE release, scheduled for 29 October, is therefore the first test of whether the dissenters or the majority read the trend correctly.
What the Treasury Curve Is Pricing
Markets have already sided with a tighter path. On 27 October, the 2-year Treasury yield stood at 4.70%, roughly 82bp above the 3.88% effective fed funds rate. Because the 2-year yield is largely an average of expected policy rates over the next two years, a gap of that size implies further hikes rather than a long pause. Ahead of the meeting, futures pricing summarized by CME FedWatch put the probability of a December hike at about 84%.
Further out, the 10-year yield stood at 4.99% on the same date, leaving the 2s10s spread at a modest 29bp. A flat-to-gently-positive curve with short rates pricing hikes is consistent with a market that believes the Fed will tighten, but doubts it will need to tighten aggressively.
Three scenarios frame the next few months:
- Energy fades, core stays put: headline converges toward core, real rates rise passively without further hikes, and the majority’s patience is vindicated. Front-end yields would likely have the most room to fall.
- Energy stays high, core stays put: the Committee faces a growing credibility cost from headline inflation near 4%, and the dissenters’ case for a December hike gains ground even without second-round effects.
- Second-round effects appear: core CPI and core PCE start to accelerate, the deflator debate becomes moot, and the market’s hiking path would likely extend into 2027.
Why the Deflator Debate Matters for Portfolios
For fixed-income investors, the split matters more than the hold. A committee that measures its stance against core inflation is effectively signaling a ceiling on the hiking cycle. A committee that targets headline inflation leaves the terminal rate (i.e. the peak policy rate of the cycle) open-ended for as long as energy prices stay elevated.
- Duration risk: front-end yields are most sensitive to which camp wins, since the 2-year already embeds a meaningful hiking premium over the policy rate.
- Inflation breakevens: a sustained headline-core gap tends to widen the spread between nominal and inflation-linked yields at short maturities more than at long ones.
- Credit: higher-for-longer front-end rates raise floating-rate funding costs, a pressure that falls hardest on lower-rated, leveraged borrowers.
- Communication risk: two dissents in favor of tighter policy make each subsequent statement, and each energy-heavy CPI print, a potential volatility event.
Conclusion
The October hold was not a dovish pivot; it was a disagreement about measurement. On core CPI the Fed is already running a real policy rate above 1pp, while on headline CPI it is essentially at zero. The 115bp gap between the two measures is almost entirely an energy story, and the outcome of the hiking cycle now depends on whether that story stays contained.
The variables to watch are the September PCE release on 29 October, the October CPI report, and any sign of energy costs feeding into core services prices. If core PCE holds near 3% while headline stays elevated, the dissenting minority may well become the majority by December.
Sources: Federal Reserve FOMC statement (28/10/2026); FRED: CPIAUCSL, CPILFESL, CPIENGSL, FEDFUNDS, DFF, PCEPI, PCEPILFE, DGS2, DGS10; Yahoo Finance FOMC live coverage; Trading Economics.
Daniel Panizo, CFA, FMVA


Leave a Reply