
The European Central Bank left its three key rates unchanged on 29 October 2026: the deposit facility rate (DFR) stays at 2.50%, the main refinancing rate at 2.65% and the marginal lending rate at 2.90%. The pause follows two 25bp hikes, on 17 June and 16 September, which reversed half of the 100bp of cuts the ECB delivered between February and June 2025.
The hold matters because it came with headline inflation moving the other way. Euro area HICP inflation rose to 3.8% in September from 3.2% in August, against 2.2% a year earlier. Measured against that figure, the policy rate is now further below inflation than at any point since early 2025. The question for rates markets is whether that gap is a policy error in the making or a deliberate decision to look through an energy shock.
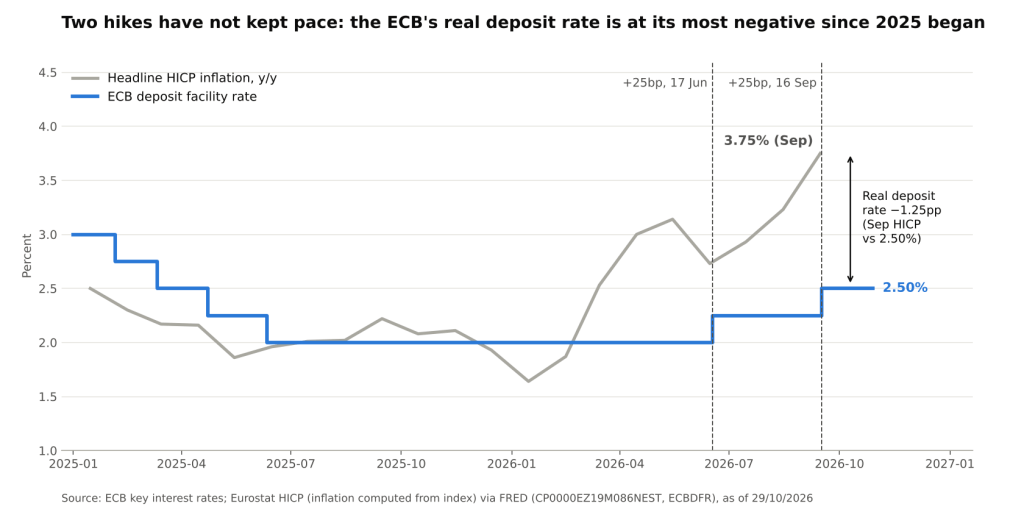
ECB deposit facility rate vs euro area headline HICP inflation, year-on-year, computed from the index (ECB; Eurostat via FRED @ 29/10/2026)
A Negative Real Rate, Depending on the Deflator
The ex-post real deposit rate (i.e. the nominal policy rate minus realized inflation) depends heavily on which inflation measure is used. Three readings of the same September data give three different stances:
- Against headline HICP (3.8%): the real DFR is about -1.3pp, which looks clearly accommodative for a central bank in a hiking cycle.
- Against inflation excluding energy (2.3%): the real rate is roughly +0.2pp, close to neutral territory.
- Against core HICP (2.5%): i.e. excluding energy, food, alcohol and tobacco, the real rate is exactly zero.
That spread between measures is the whole debate. Standard policy logic says a central bank should look through a supply shock (i.e. a price rise driven by constrained supply rather than excess demand) as long as inflation expectations stay anchored, because hiking into it would deepen the growth hit without addressing its cause. The ECB’s two hikes this year suggest it judged the shock large and persistent enough to lean against. The October pause suggests it does not yet see the shock spreading into the rest of the basket.
Decomposing September’s 3.8%
Eurostat’s component data show how concentrated the acceleration is. Energy carries a weight of just 90.3‰ (about 9%) in the HICP basket, yet energy prices rose 18.9% year-on-year in September, up from 14.3% in August, with a 4.0% rise in the month alone.
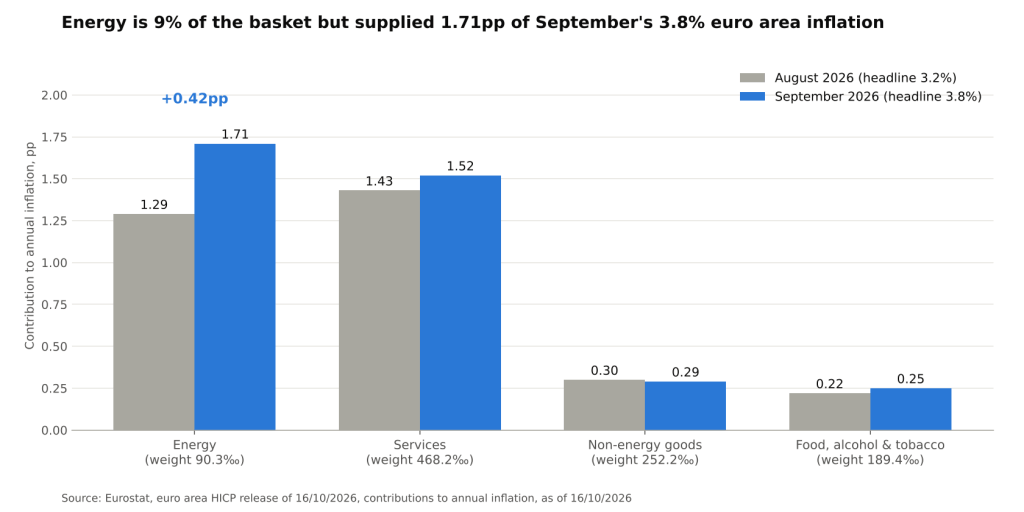
Contributions to euro area annual HICP inflation by main component, August vs September 2026, in percentage points (Eurostat @ 16/10/2026)
In contribution terms, energy added 1.71pp to September’s headline, roughly 45% of the total, despite its small weight. Its contribution rose by 0.42pp from August, around four-fifths of the month’s increase in summed contributions. The other components moved far less:
- Services: inflation edged up to 3.2% from 3.0%, lifting its contribution to 1.52pp from 1.43pp. This is the component most sensitive to wages and domestic demand.
- Non-energy industrial goods: slipped to 1.1% from 1.2%, contributing 0.29pp.
- Food, alcohol and tobacco: rose to 1.3% from 1.1%, contributing 0.25pp.
Strip energy out and the remaining components together contributed about 2.06pp, a profile that would sit near the ECB’s 2% target. Core inflation at 2.5%, up only 0.1pp on the month, tells the same story: the shock is large, but it is still mostly an energy story.
The Second-Round Test
The case for holding rests on the absence of second-round effects (i.e. energy costs feeding into wages and broader price setting). The ECB’s statement said underlying inflation measures have stayed broadly stable while early stages of the pricing chain point to upward pressure, and it framed inflation risks as tilted to the upside and growth risks to the downside. The indicators that would decide the next move are visible:
- Wages: compensation per employee grew 3.3% in the second quarter, down from 3.6% in the first. Decelerating pay growth is the strongest argument that the energy shock has not yet triggered a wage-price loop.
- Labor market: unemployment stood at 6.4% in August. Any sharp tightening from here would raise the risk that workers seek to recoup lost purchasing power through higher pay demands.
- Services inflation: at 3.2%, it is above target but moved only 0.2pp in September. A sustained climb here would be the clearest sign that the shock is broadening.
- Pipeline pressures: producer and input prices are where energy costs show up first; the ECB flagged them as the early warning.
The ECB was explicit that it is not pre-committing to a rate path and will decide meeting by meeting, which leaves December, when new staff projections are due, as the natural point to reassess.
Balance Sheet, Dollar Gap and Market Implications
Rates are not the only tightening channel. The ECB no longer reinvests principal from maturing securities in its APP and PEPP portfolios, so its bond holdings continue to run off passively. That keeps a steady supply of duration flowing back to private investors even while the policy rate is on hold, a quieter form of restraint than a hike.
Across the Atlantic, the Fed’s target range has an upper bound of 4.00% as of 29 October, leaving a policy rate gap of about 150bp over the ECB’s deposit rate. The euro traded at 1.1199 dollars on 23 October. For market participants, the implications are mostly about which inflation measure ends up driving each central bank:
- Front-end rates: euro short-dated yields are likely to stay highly sensitive to monthly core and services prints rather than to headline, since that is where the ECB has signaled its reaction function.
- Curve shape: an energy shock that hits growth while the central bank holds tends to favor a steeper curve, as term premium absorbs inflation uncertainty while expectations of near-term hikes fade.
- Credit: energy-intensive sectors face a margin squeeze with financing costs no longer falling, which places more weight on issuer-level pricing power than on broad beta.
- FX: a persistent 150bp policy differential is a structural headwind for the euro, though relative growth and energy terms of trade matter as much as the rate gap.
Conclusion
The October hold is best read as a bet that the euro area is facing an energy price shock rather than a broad inflation problem. On headline inflation, the real deposit rate is clearly negative; on core, it is neutral. With energy contributing 1.71pp of the 3.8% headline and wage growth slowing, the ECB has room to wait, but only as long as the shock stays contained in the energy line.
The next tests come quickly. Eurostat’s October flash estimate is scheduled for 4 November, and the December meeting brings fresh staff projections. A further rise in services or core inflation would shift the debate back toward hiking; a stabilization in energy would validate the pause.
Sources: ECB monetary policy decisions, 29 October 2026; ECB monetary policy statement, 29 October 2026; ECB key interest rates; Eurostat euro indicators, HICP September 2026; FRED: CP0000EZ19M086NEST, ECBDFR, DFEDTARU, DEXUSEU.
Daniel Panizo, CFA, FMVA


Leave a Reply