
ExxonMobil reported third-quarter 2026 results on October 30, and the headline figure was $19.1 billion of free cash flow (i.e. operating cash flow less capital spending), roughly three times the $6.3 billion it generated a year earlier. Operating cash flow reached $25.7 billion. Those are the numbers of a company riding an oil price spike: Brent averaged $114.16 per barrel in September, against $62.54 in December 2025, and the daily price stood at $123.10 on October 27.
The more revealing number is the one that barely moved. Shareholder distributions, i.e. dividends plus buybacks, were $9.4 billion in the quarter, the same as a year ago and within a $9.2–9.5 billion band for five straight quarters. The gap between what Exxon earns and what it pays out has flipped sign, and the balance sheet is absorbing the difference. That design choice matters for anyone modeling integrated oil cash flows through a commodity cycle.
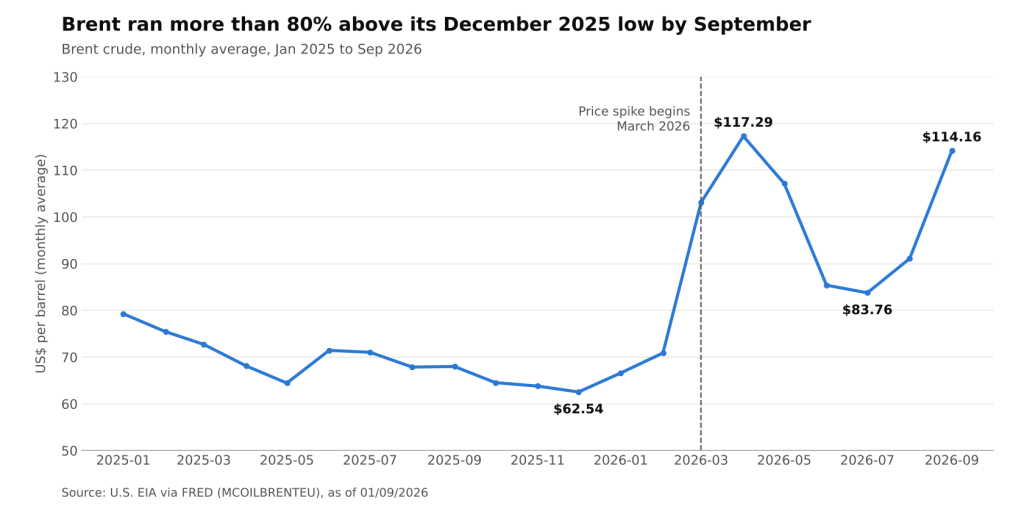
Brent crude, monthly average, January 2025 to September 2026 (U.S. EIA via FRED, MCOILBRENTEU @ 01/09/2026)
A Payout Set by Plan, Not by Price
Exxon frames its capital return as a fixed program rather than a variable payout. In its first-quarter release it said it was on pace to repurchase $20 billion of shares in 2026, and with third-quarter results it announced another $20 billion buyback for 2027, conditional on reasonable market conditions. The fourth-quarter dividend was declared at $1.07 per share.
The practical consequence is that distributions behave like a fixed-coupon obligation while free cash flow behaves like an option on the oil price. The chart below shows how far apart the two have drifted.
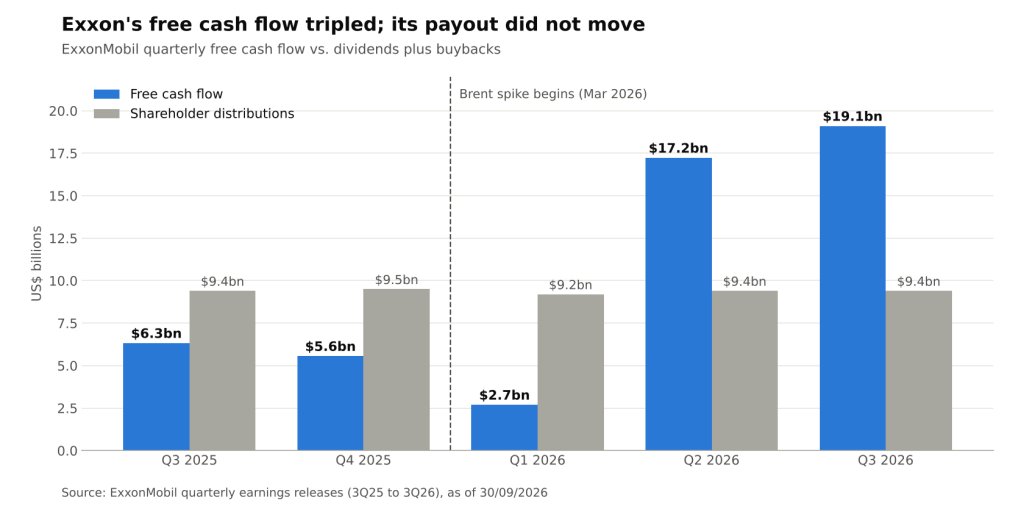
ExxonMobil quarterly free cash flow vs. dividends plus buybacks, Q3 2025 to Q3 2026 (ExxonMobil earnings releases @ 30/09/2026)
Three phases stand out:
- Overdistribution in 2025. Full-year 2025 free cash flow was $26.1 billion against $37.2 billion of distributions, a shortfall of about $11.1 billion funded from the balance sheet.
- A collateral squeeze in Q1 2026. Operating cash flow fell to $8.7 billion, or $13.8 billion excluding margin postings, i.e. cash collateral posted against derivative positions as prices jumped. Free cash flow of $2.7 billion covered less than a third of the $9.2 billion payout.
- A surplus from Q2 onward. Free cash flow of $17.2 billion in Q2 and $19.1 billion in Q3 covered distributions roughly 1.8x and 2.0x respectively.
Where the Surplus Went
Year-to-date free cash flow reached $39.0 billion, up from $20.6 billion in the first nine months of 2025. Summing the three quarterly headline figures, distributions came to about $28.0 billion, leaving a surplus of roughly $11.0 billion. That lines up with the company’s own description of nearly $11 billion of year-to-date net debt reduction. At September 30, total debt was $34.3 billion and cash $12.2 billion, for net debt of $22.1 billion.
The symmetry is the point. In 2025 the balance sheet lent roughly $11 billion to the buyback program; in 2026 so far, the oil spike has repaid about the same amount. The buyback did not scale up with the windfall, and spending did not either: cash capital expenditures were $20.0 billion year to date, about 5.5% below the $21.1 billion of the same period in 2025.
Reading the Quarter Correctly
Headline free cash flow overstates the underlying improvement between Q2 and Q3. Several mechanical items sit between earnings, operating cash flow and the cash that is truly recurring:
- Working capital swung. Operational working capital released $2.2 billion of cash in Q3 after absorbing $2.1 billion in Q2. Excluding it, operating cash flow actually fell from $25.7 billion to $23.4 billion quarter on quarter.
- Prices eased within the quarter average. Exxon attributed lower sequential upstream earnings to lower prices and an accelerated Guyana entitlement effect. The simple average of monthly Brent values was about $96 in Q3 versus about $103 in Q2, even though September’s average came close to April’s peak.
- Timing effects distort GAAP earnings. Reported earnings were $15.4 billion, while adjusted earnings, which strip out identified items and estimated derivative timing effects, were $17.5 billion. Timing effects alone reduced Q3 earnings by about $2.5 billion.
- Volumes are lower. Upstream production was 4,496 thousand oil-equivalent barrels per day (koebd) in Q3, about 5.7% below the 4,769 koebd of Q3 2025. Year to date, the company cited Middle East volume impacts partly offsetting growth in Guyana, the Permian and Golden Pass LNG.
For valuation work, the cleaner series is operating cash flow excluding working capital: $59.6 billion year to date versus $44.3 billion a year earlier. That still shows a large price-driven uplift, but without the quarter-to-quarter noise of collateral and inventory movements.
Why the Fixed-Payout Model Matters
A fixed buyback has clear advantages in a volatile commodity business, and some costs:
- Credibility across the cycle. Distributions stayed above $9 billion through a quarter when free cash flow was $2.7 billion, which is what makes a multi-year buyback commitment believable to investors.
- Countercyclical leverage. Debt reduction in high-price periods rebuilds the capacity that was drawn down in low-price periods, so leverage, not the payout, absorbs commodity risk.
- Pro-cyclical buyback pricing is avoided. A payout that scaled with free cash flow would buy the most stock when energy equities are typically richest; a flat program avoids that tendency.
- The cost is opportunity. Cash held or used to repay debt earns less than the cost of equity if the balance sheet was already conservative, and a fixed program can look stingy to investors who expected the windfall to be shared.
For credit analysts, the message is supportive: the surplus in this cycle has gone toward net debt reduction rather than toward a larger payout. For equity analysts, the useful exercise is to separate the fixed $20 billion buyback from the residual cash flow and treat the latter as balance-sheet optionality, not as an implied increase in distributions.
Conclusion
Exxon’s Q3 2026 results show an integrated major converting an oil price spike into balance-sheet repair rather than a bigger payout. Free cash flow tripled year on year to $19.1 billion, distributions stayed at $9.4 billion, and roughly $11 billion of year-to-date surplus mirrors the shortfall that 2025’s payout ran up.
What to watch next: whether the 2027 buyback stays at $20 billion if Brent remains above $100, how much of Q3’s working capital release reverses in Q4, and whether volumes recover from the Middle East volume impacts. If prices fall back, the same fixed program would again draw on the balance sheet, which is exactly the trade-off the model is built around.
Sources: ExxonMobil, Third-Quarter 2026 Results; ExxonMobil, Second-Quarter 2026 Results; ExxonMobil, First-Quarter 2026 Results; ExxonMobil, 2025 Results; ExxonMobil, Third-Quarter 2025 Results; FRED, Brent crude monthly (MCOILBRENTEU); FRED, Brent crude daily (DCOILBRENTEU).
Daniel Panizo, CFA, FMVA


Leave a Reply