
The S&P 500 has spent the third-quarter reporting season delivering profit growth more than double its ten-year average, yet the more consequential number for valuation sits in the bond market. The 10-year Treasury Inflation-Protected Securities (TIPS) yield, i.e. the real return on a risk-free government bond, averaged 2.64% in September 2026 and printed 2.67% on 28 October. That is the highest monthly reading in the ten-year FRED window shown below, above the 2.41% peak of October 2023.
Equities have not ignored the move, but they have absorbed it mostly through earnings rather than price. The result is a valuation whose cushion over risk-free assets is much thinner than it looks on a headline P/E basis. For anyone building a discount rate, setting a hurdle rate or judging how much rate risk sits inside an equity book, the relevant question is no longer whether stocks are expensive on their own history, but how much they pay over a bond that now offers a real return near 2.7%.
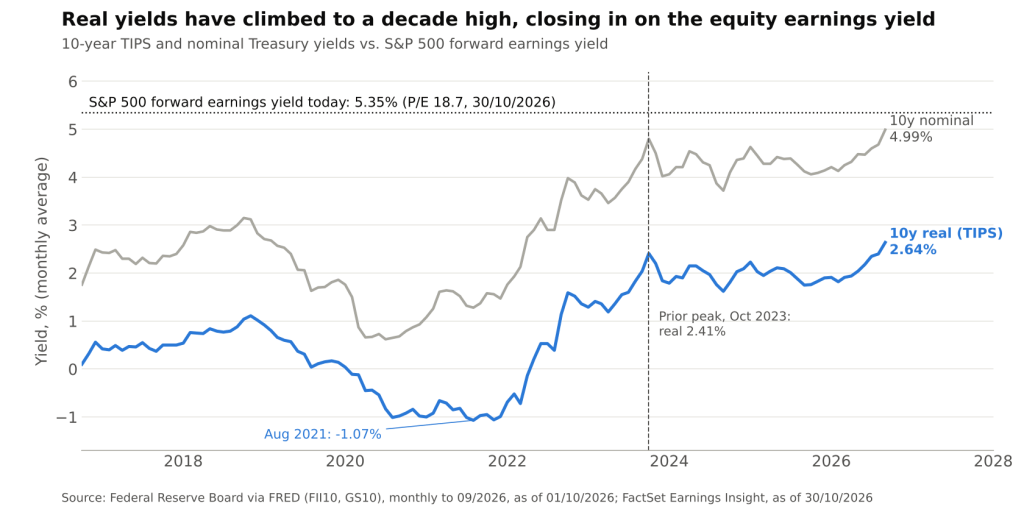
10-year real and nominal Treasury yields (monthly averages) vs. the S&P 500 forward earnings yield (FRED FII10, GS10 and FactSet Earnings Insight @ 30/10/2026)
The Arithmetic of a Thin Cushion
FactSet puts the S&P 500 forward 12-month P/E at 18.7 in its 30 October report, down from 19.0 at the end of September and below both its five-year (19.8) and ten-year (19.1) averages. Inverting the multiple gives a forward earnings yield of about 5.35%, i.e. the next twelve months of expected earnings per dollar of index price.
Set against Treasuries, that yield leaves little room:
- Versus the real yield: 5.35% minus the 2.67% TIPS yield (28 October) leaves a gap of about 2.68 percentage points. Because corporate earnings broadly reprice with inflation over time, this is the cleaner comparison and a rough proxy for the implied equity risk premium (ERP).
- Versus the nominal yield: 5.35% minus the 4.98% 10-year Treasury yield (29 October) leaves just 0.37 percentage points, a reading often called the “Fed model” spread.
- Versus recent history: using the five-year average forward P/E (19.8, an earnings yield of about 5.05%) against average yields over October 2021 to September 2026 (1.47% real, 3.83% nominal) produces gaps of roughly 3.58 and 1.22 percentage points. The real-yield cushion is therefore about 0.90pp thinner than that five-year basis, and the nominal cushion about 0.85pp thinner.
The five-year comparison is an approximation, since an average of P/E ratios inverted is not the same as an average of earnings yields, and the yield-gap framework itself has known weaknesses: it ignores growth expectations and treats a single forward year as a perpetuity. It is still useful as a relative gauge. When the same index multiple sits on top of a risk-free real rate that is more than a full percentage point higher than its recent norm, the market is accepting a smaller premium for equity risk.
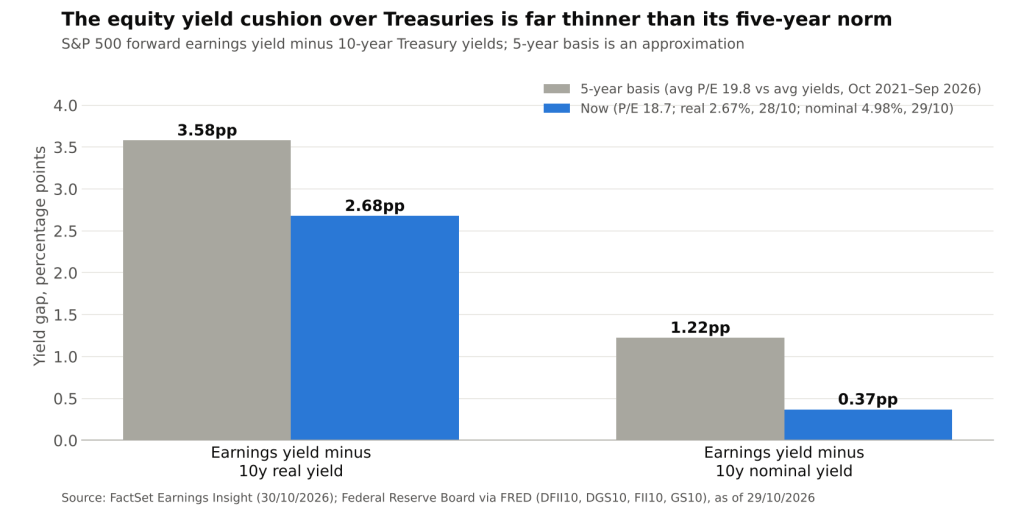
S&P 500 forward earnings yield minus 10-year Treasury yields, now vs. an approximate five-year basis (FactSet and FRED DFII10, DGS10, FII10, GS10 @ 29/10/2026)
Why Earnings Have Carried the Load
The multiple has compressed only modestly because the denominator has done the heavy lifting. With 60% of companies reported, FactSet shows 82% beating EPS estimates and a blended third-quarter earnings growth rate of 30.2%, against a five-year average of 13.3%. Revenue is growing 13.4%, and forward 12-month EPS estimates have risen 2.5% since 30 September. Analysts expect calendar-2026 earnings growth of 32.9% and 16.3% for 2027.
Beneath the headline, three details argue for caution in extrapolating that support:
- Smaller surprises: the aggregate EPS surprise is +1.9%, well below the five-year average of +7.5%. Companies are beating, but by thinner margins than usual.
- Margins off the peak: the blended net profit margin is 14.9%, down from a record 17.0% in the prior quarter, though still above the five-year average of 12.6%.
- Guidance is constructive for now: only 19 of 47 companies issuing fourth-quarter EPS guidance (40%) guided negatively, against a five-year average of 60%. That is the main offset to the margin and surprise data.
Strong earnings growth explains why the forward P/E has drifted lower without a disorderly repricing. It does not change the fact that the premium over the risk-free asset has narrowed: growth has been priced in, while the hurdle it must clear has risen.
What It Means for Cost of Capital
For corporate finance practitioners, the gap between the market-implied premium and textbook inputs creates practical tension in valuation work:
- DCF inputs diverge from market pricing: a CAPM cost of equity built from a ~5% nominal risk-free rate plus a historical ERP will exceed the index’s 5.35% earnings yield by a wide margin. A DCF built that way will tend to show the market as rich, because the market is clearing at a lower premium than the model assumes.
- Sensitivity is material: as an illustration, if the real-yield gap returned to the approximate five-year basis of 3.58pp with the TIPS yield unchanged at 2.67%, the implied earnings yield would be 6.25%, consistent with a forward P/E near 16.0, about 14% below today’s 18.7. This is arithmetic, not a forecast.
- Equity duration matters by sector: sectors on high forward multiples, such as Consumer Discretionary at 23.8 and Industrials at 22.8, carry more of their value in distant cash flows and are more exposed to discount-rate changes than Energy (13.2) or Financials (14.9).
- Capital return economics shift: with the 10-year Treasury near 5%, debt-funded buybacks become less accretive, because the after-tax cost of borrowing moves closer to the earnings yield on retired shares. Cash-funded repurchases face a similar test against the yield on holding Treasuries.
Three Paths From Here
- Earnings-led normalization: if profits keep growing at anything like the expected 16.3% pace for 2027, the forward P/E falls as estimates roll forward at a given index level, rebuilding the cushion without a price decline.
- Rate-led relief: a retreat in real yields toward their five-year average would restore the premium mechanically, with high-multiple sectors the main beneficiaries.
- Premium-led compression: if real yields stay near current levels while earnings surprises keep shrinking and margins continue to ease from the 17.0% record, the adjustment would have to come through the multiple itself.
Conclusion
The third-quarter season has been strong enough to keep the S&P 500’s forward multiple below its five- and ten-year averages, but that is the wrong benchmark in a world where the 10-year real yield sits near 2.7%. Measured against Treasuries, the equity earnings yield offers a premium of about 2.7pp over real yields and under 0.4pp over nominal yields, both materially below the approximate five-year basis.
The variables to watch are the TIPS yield, the size of earnings surprises as the remaining 40% of companies report, and whether margins stabilize near 15%. Cost-of-capital assumptions anchored to the five-year average real yield of 1.47% now understate how far the risk-free leg of the hurdle has moved.
Sources: FRED, 10-Year TIPS Yield (DFII10); FRED, 10-Year Treasury Yield (DGS10); FRED, FII10 monthly; FRED, GS10 monthly; FactSet Earnings Insight, 30 October 2026.
Daniel Panizo, CFA, FMVA


Leave a Reply