
Fitch Ratings reported on 29/10/2026 that its U.S. Private Credit Default Rate (PCDR) reached 6.3% for the twelve months to the end of the third quarter, up from 6.0% at the end of June and the highest reading in the series. The rate has now risen every quarter since Q3 2025. The headline number is striking on its own, but the more useful detail for credit analysts sits underneath it: almost none of these defaults look like the defaults most investors picture.
Over the trailing twelve months, 88% of default events were soft restructurings, i.e. interest deferrals, payment-in-kind (PIK) introductions and stressed maturity extensions, rather than missed payments or bankruptcy filings. That composition changes how the number should be read, what it implies for eventual losses, and why public market pricing can look calm while private credit stress keeps building.
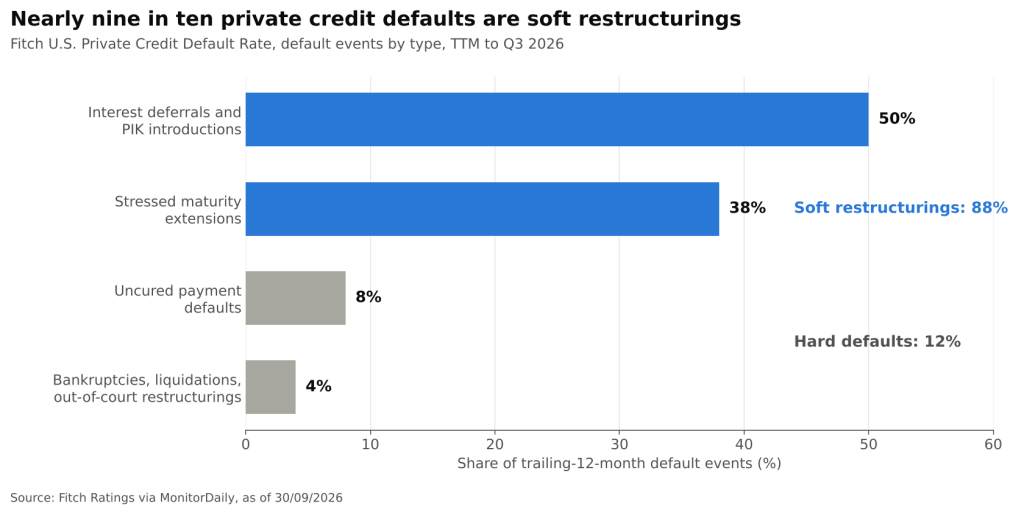
Fitch U.S. Private Credit Default Rate, share of trailing-12-month default events by type (Fitch Ratings via MonitorDaily @ 30/09/2026)
What Counts as a Default in Private Credit
Fitch’s definition is broader than a simple payment test. A borrower that cannot service its debt in cash and agrees with its lenders to capitalize interest, or to push out a maturity it could not refinance, is counted as a default even though no payment was technically missed. In the twelve months to Q3 2026 the split was:
- Interest deferrals and PIK introductions: 50%. Cash interest is replaced, partly or fully, by interest added to principal. The lender’s claim grows while the borrower’s cash burden falls.
- Stressed maturity extensions: 38%. Lenders extend a loan the borrower cannot refinance on market terms, usually in exchange for fees, tighter covenants or a higher margin.
- Uncured payment defaults: 8%. The classic missed coupon or principal payment that is not remedied.
- Bankruptcies, liquidations and out-of-court restructurings: 4%. The hard end of the spectrum, where the capital structure is reorganized or wound down.
The third quarter alone followed the same pattern. Fitch counted 27 default events from 20 new unique defaulters: 13 deferrals or PIK introductions, 10 maturity extensions, 3 bankruptcies, liquidations or out-of-court restructurings and just 1 uncured payment default. Soft events were therefore 23 of 27, or about 85% of the quarter’s total. On a trailing basis, unique defaulters rose to 91 from 84 at the end of June.
Why Soft Defaults Dominate
The mix is not an accident. It reflects the structure of direct lending, where a small club of lenders, often a single fund, holds the entire loan. That concentration makes amend-and-extend far easier than in the broadly syndicated market, and the incentives point in the same direction for both sides:
- Lenders avoid realizing losses. A PIK toggle or extension keeps the loan performing on paper and avoids a mark-to-market write-down or a costly workout.
- Sponsors preserve equity optionality. Private equity owners keep control and buy time for earnings to recover or for rates to fall.
- Borrowers conserve cash. With floating-rate debt, higher base rates hit interest coverage directly. Fitch attributed the pressure to persistently high real rates; the 10-year TIPS real yield stood at 2.63% as of 29/10/2026 (FRED, DFII10).
The trade-off is that soft restructurings postpone, rather than resolve, the underlying problem. PIK interest increases the debt balance, so a borrower that cannot pay cash interest today owes more tomorrow. A maturity extension buys time but leaves leverage unchanged. If earnings do not recover, a share of today’s soft defaults may become tomorrow’s hard ones, and the loss is recognized later and potentially on a larger claim.
The Record Headline Masks Diverging Portfolios
The PCDR combines two Fitch portfolios with different owners. Privately Monitored Ratings (PMRs) are generally used by insurers that need loan-level ratings for regulatory capital. Model-Based Credit Opinions (MCOs) feed the ratings of pooled vehicles such as middle-market CLOs, i.e. securitizations backed by loans to smaller companies. In Q3 they moved in opposite directions.
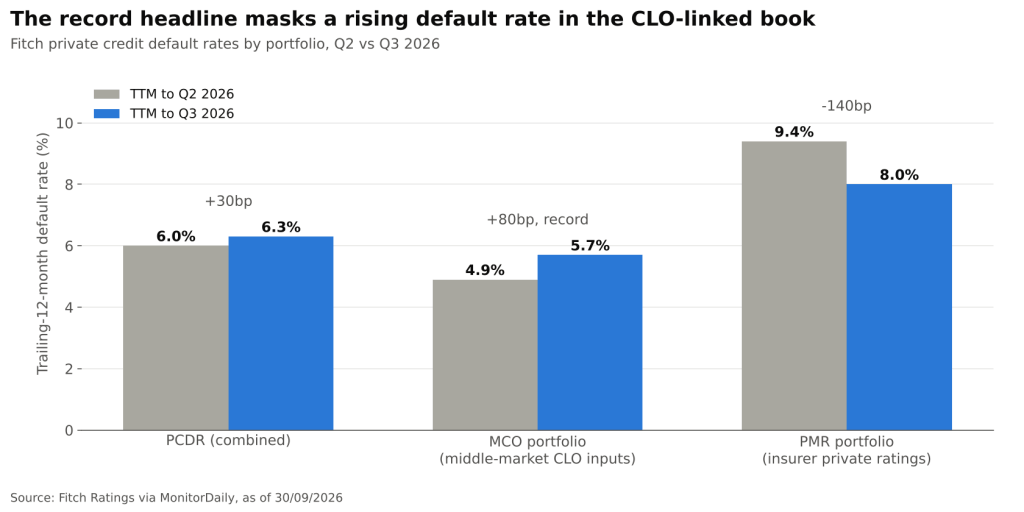
Fitch trailing-12-month private credit default rates by portfolio, Q2 vs Q3 2026 (Fitch Ratings via MonitorDaily @ 30/09/2026)
The MCO default rate rose 80bp to a record 5.7%, while the PMR rate fell 140bp to 8.0%. Fitch attributed the PMR decline to fewer defaults and to growth in the denominator as that portfolio expanded quickly. That second point is a reminder that a default rate is a ratio: when a book grows fast, new, recently underwritten loans dilute the rate before they have had time to season. The gap between the two portfolios narrowed from 4.5 percentage points to 2.3.
For investors, the MCO move is the more informative of the two. It describes the loans sitting inside middle-market CLOs, where rising defaults can erode overcollateralization tests, i.e. the cushions that divert cash away from junior tranches and equity when collateral quality deteriorates.
Where the Stress Is Concentrated
Sector dispersion is wide. Industrials and Manufacturing and Consumer Products and Services each posted a trailing default rate of 9.7%. Healthcare Providers had the most unique defaulters, 16, although the sector rate eased to 8.7% from 9.4%. Technology Software sat at only 0.6%, down from 1.2%, though Fitch noted several defaults among technology-driven businesses classified in other sectors.
Public credit markets tell a calmer aggregate story. The ICE BofA US High Yield Index option-adjusted spread was 3.26% on 29/10/2026, against 13.25% for the CCC and lower segment (FRED, BAMLH0A0HYM2 and BAMLH0A3HYC). The roughly 10 percentage-point gap suggests that public markets are pricing stress in the weakest credits rather than across the whole leveraged universe, which is broadly consistent with the soft, borrower-specific pattern in private credit. The comparison has limits, however: private loans are not marked daily, and soft defaults rarely produce the price shock that would show up in a spread index.
Analytical Implications
- Default rates and loss rates are diverging. A high default rate made up mostly of PIK and extensions implies lower near-term realized losses than the headline suggests, but potentially higher losses later if recoveries are struck on larger, PIK-inflated balances.
- Income quality matters more than income level. For lenders and BDCs, a rising share of PIK income flatters reported yields while cash receipts lag. Analysts should look at cash interest coverage, not only net investment income.
- Denominator effects can mislead. Fast-growing portfolios can show falling default rates while absolute defaults hold steady or rise. Counts of unique defaulters are a useful cross-check.
- Comparisons with public markets need care. Syndicated loan and high yield default series use different definitions and tend to capture hard defaults more fully, so private and public rates are not directly comparable.
Conclusion
Private credit defaults are at a record 6.3%, but 88% of the events behind that number are soft restructurings negotiated between lenders and borrowers. That keeps realized losses contained for now, at the cost of larger claims and deferred recognition. The divergence between a record MCO rate and a falling PMR rate shows that the headline blends very different portfolios, with stress rising fastest in the loans that back middle-market CLOs.
The key signals to watch are whether Fitch’s Q4 data show soft defaults converting into payment defaults and bankruptcies, the trend in PIK income across BDC third-quarter filings, and the path of real yields. A sustained decline in real rates would ease debt service for floating-rate borrowers; persistence at current levels would test how long amend-and-extend can keep defaults soft.
Sources: MonitorDaily, Fitch Ratings: U.S. Private Credit Default Rate Remains Elevated in Q3; Fitch Ratings, U.S. Private Credit Default Rate Remains Elevated in 3Q26; Forbes, U.S. Private Credit Defaults Hit Record 6.3%; FRED, 10-Year TIPS Real Yield (DFII10); FRED, ICE BofA US High Yield OAS (BAMLH0A0HYM2); FRED, ICE BofA CCC & Lower OAS (BAMLH0A3HYC).
Daniel Panizo, CFA, FMVA



Leave a Reply