
The line between investment grade and high yield is the most consequential boundary in corporate credit. A single notch, from BBB- to BB+, decides which mandates can own a bond, which index it sits in and which buyers set its price. In late October that boundary was back in focus: on 30 October S&P Global Ratings moved Meta Platforms to a negative outlook, citing balance-sheet pressure from AI capital spending, on a day when the Nasdaq 100 fell 3.5%. The action is an outlook change rather than a downgrade, but it is a reminder that rating migration, not default, is the dominant risk in the upper half of the credit market.
The ICE BofA indices published via FRED show how the market is pricing that boundary. As of 29 October 2026, the BBB option-adjusted spread (OAS, i.e. the spread over Treasuries after stripping out embedded options) stood at 110bp, while the BB OAS stood at 194bp. That 84bp step is the largest move between any two adjacent rating buckets from AAA down to BB, and it has been widening quickly.
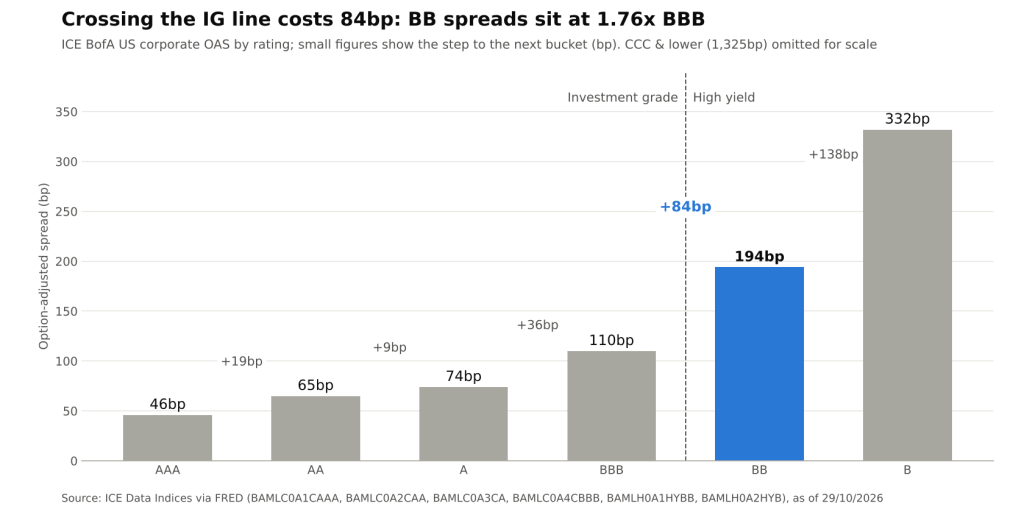
Option-adjusted spreads by rating bucket, ICE BofA US indices; CCC & lower omitted for scale (ICE Data Indices via FRED @ 29/10/2026)
The Shape of the Rating Curve
Spreads do not rise in a straight line as ratings fall. Across investment grade the steps are modest: AAA at 46bp, AA at 65bp, single-A at 74bp and BBB at 110bp. The whole span from AAA to BBB is 64bp. Crossing into high yield then adds 84bp in a single step, and the next step, BB to single-B at 332bp, adds a further 138bp. At the bottom, CCC & lower trades at 1,325bp.
The convexity has a clear structural cause. The jump at the boundary is only partly about default probability, which remains low for BB issuers relative to single-B. It is mostly about the buyer base. Insurance companies, many pension plans and IG-benchmarked funds face capital charges, limits or outright prohibitions on holding high-yield debt. When a bond crosses the line, the pool of natural owners shrinks and the marginal buyer becomes a high-yield investor with a higher required return.
A useful way to read the curve is as a ratio. On 29 October, BB spreads were 1.76x BBB spreads. That multiple is the market’s price for crossing the line, expressed relative to where investment-grade risk already trades.
From 54bp to 84bp in Two Months
The crossover gap was unusually compressed at the end of the summer. On 31 August 2026, BB OAS was 152bp against 98bp for BBB, a gap of just 54bp and a ratio of 1.55x. That was the narrowest gap among the quarter-end and recent dates reviewed here, which run back to September 2024.
The repricing since then has been concentrated on the high-yield side of the line. By 29 October, BB spreads had widened 42bp while BBB spreads had widened only 12bp. The gap reached 98bp on 1 October, the widest of the October dates reviewed, before easing to 84bp. Day-to-day moves have also been larger in BB: between 28 and 29 October, BB OAS rose 10bp while BBB rose 3bp.
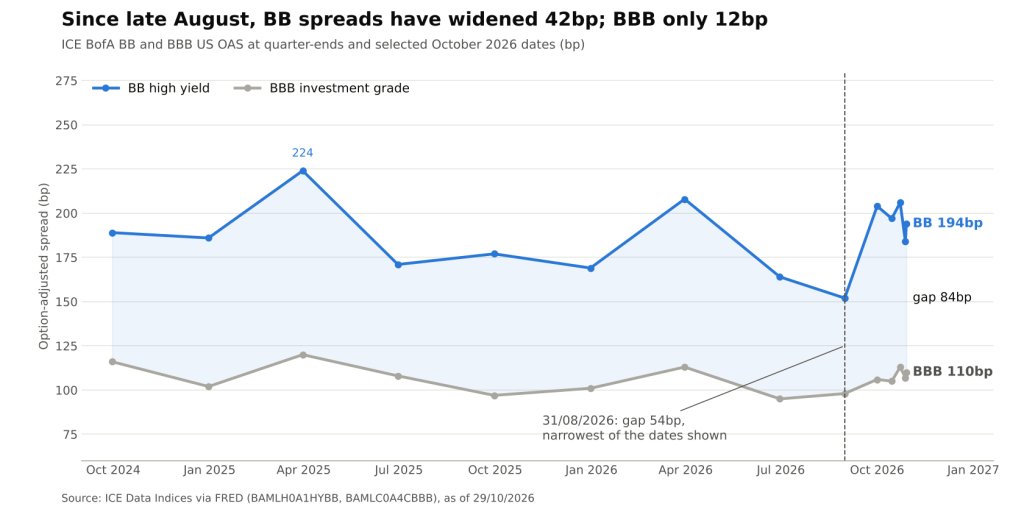
BB and BBB option-adjusted spreads at quarter-ends and selected October dates; shaded area is the crossover gap (ICE Data Indices via FRED @ 29/10/2026)
Two features of the series stand out. First, the gap moves with BB spreads: it was widest at the end of March 2025 (104bp) and March 2026 (95bp), the two quarter-ends with the highest BB spreads in the sample (224bp and 208bp), and it narrowed as BB spreads fell. Second, BBB spreads have stayed in a narrow band, between 95bp and 120bp on every date shown. Most of the variation in the crossover gap therefore comes from BB, not BBB.
Why the Gap Matters More Than the Level
Headline spread levels look contained: the overall ICE BofA US high-yield OAS was 326bp and the investment-grade index 89bp on 29 October. Focusing on levels alone misses where the adjustment is happening. Three mechanics explain why the crossover gap is the more informative signal:
- Fallen-angel risk. A BBB issuer downgraded to BB reprices toward BB spreads. A wider gap raises the mark-to-market cost of a downgrade for IG holders, which in turn raises the value of avoiding names with negative outlooks.
- Forced selling. Because many IG holders must reduce or exit positions after a downgrade, the price impact of a fallen angel is often front-loaded. A compressed gap, like the one seen in August, offers little cushion for that technical pressure.
- Rising-star optionality. The same gap works in reverse for BB issuers on positive trajectories. An upgrade to BBB- broadens the buyer base and compresses spreads toward IG levels, so a wider gap increases the payoff from successful deleveraging.
Put differently, the gap is the price of the rating cliff. When it is narrow, investors are being paid little for migration risk on either side of the line. When it widens, the market is beginning to charge for it.
Implications for Credit Analysis
The current configuration carries several practical implications for analysts working near the boundary:
- Outlook changes deserve weight. A negative outlook signals the possibility of a downgrade over the medium term rather than an immediate action. With the gap at 84bp rather than 54bp, the cost of being wrong on a low-BBB name has risen materially.
- Leverage targets are back in focus. Issuers funding large capital programs, whether AI infrastructure or acquisitions, face a sharper trade-off between balance-sheet growth and rating stability when the crossover gap is wide.
- Relative value inside high yield. BB spreads at 1.76x BBB, compared with 1.55x at the end of August, change the comparison between the top of high yield and the bottom of investment grade. Whether that is adequate compensation depends on the migration outlook for individual issuers rather than on the index.
- Data lag. The FRED series run to 29 October and therefore do not yet reflect the 30 October equity selloff. The next prints will show whether the late-October easing in BB spreads held.
Conclusion
The rating curve is steepest where it matters most for portfolio construction. At 84bp, the step from BBB to BB exceeds the entire spread range across investment grade, and it has widened by 30bp since late August, driven almost entirely by BB repricing. The market has moved from barely charging for migration risk to charging for it again.
The key indicators to watch are the BB-to-BBB ratio, the pace of negative outlook actions on large BBB and low-A issuers financing heavy capital spending, and whether the gap holds above its summer lows once the late-October volatility is reflected in the data.
Sources: ICE BofA BBB US Corporate Index OAS (FRED); ICE BofA BB US High Yield Index OAS (FRED); ICE BofA Single-B US High Yield Index OAS (FRED); AAA, AA and Single-A US Corporate OAS (FRED); ICE BofA CCC & Lower US High Yield Index OAS (FRED); ICE BofA US High Yield Index OAS (FRED); ICE BofA US Corporate Index OAS (FRED); Bloomberg via Yahoo Finance, “Meta’s Credit Rating Outlook Downgraded to Negative by S&P” (30/10/2026).
Daniel Panizo, CFA, FMVA



Leave a Reply