
On 30 October the Bank of Japan kept its overnight call rate target at around 1.25%, by an 8–1 vote. The lone dissenter, board member Hajime Takata, proposed a move to 1.5%, arguing that underlying inflation has reached the price stability target and that the Bank should step up its approach to a neutral rate. Alongside the hold, the board unanimously agreed to more than double the pace at which it sells its exchange-traded fund (ETF) holdings, starting in January 2027.
On the surface this looks like a central bank tightening at the margin while keeping rates steady. The market picture is less comfortable. Japan’s 10-year government bond (JGB) yield has climbed to about 3.05% on a monthly-average basis, narrowing the gap with US Treasuries to roughly half its 2023 peak. In a textbook world that should have strengthened the yen. Instead, the currency is weaker than when the spread was at its widest.
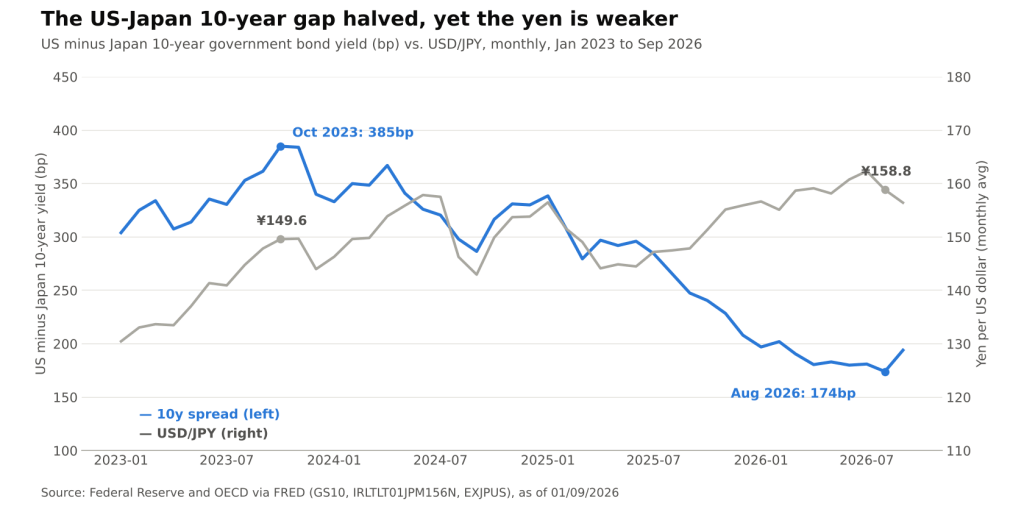
US minus Japan 10-year government bond yield (bp, left) vs. USD/JPY monthly average (right), Jan 2023 to Sep 2026 (Federal Reserve and OECD via FRED: GS10, IRLTLT01JPM156N, EXJPUS @ 01/09/2026)
A Spread That Halved Without Helping the Yen
Using monthly averages, the US–Japan 10-year spread peaked at 385bp in October 2023, when the US 10-year averaged 4.80% and the JGB 0.95%. By August 2026 it had compressed to 174bp, before widening to 194bp in September as Treasuries sold off. Over the same window USD/JPY moved from 149.6 to 158.8 on a monthly-average basis, with a peak of 162.3 in July 2026. The most recent daily reading on FRED, from 23 October, was 156.87.
The divergence is concentrated in the last year. Between September 2025 and September 2026, the JGB 10-year rose by 140.5bp, from 1.645% to 3.05%, against an 87bp rise in the US 10-year, from 4.12% to 4.99%. Japanese long yields did most of the converging, yet the yen did not reward them.
Three mechanics help explain why long-end convergence has not translated into currency strength:
- Carry lives at the front end. Yen-funded carry trades (i.e. borrowing in yen to hold higher-yielding assets) key off short-term funding costs, not 10-year yields. With the policy rate at 1.25%, the yen remains a cheap funding currency, and a held rate does little to change that calculation.
- Real rates matter more than nominal ones. The BoJ’s own median forecast puts core CPI (less fresh food) at 2.5% for fiscal 2026. Against a 1.25% policy rate, that implies a forecast-based real policy rate of roughly −1.25pp. Negative real short rates tend to weigh on a currency regardless of where nominal long yields sit.
- Why yields rise matters as much as how far. When long yields climb because investors expect tighter policy, the currency usually firms. When they climb because investors demand more term premium (i.e. extra compensation for holding duration, often tied to fiscal or inflation risk), yields and the currency can weaken together. The pattern of the past year is closer to the second case.
The ETF Exit: Faster, Still Glacial
The more concrete decision was on equities. Since January 2026 the BoJ has been selling ETFs at about ¥330bn a year at book value, roughly 0.05% of market trading value. From January 2027 that rises to about ¥860bn a year, or around 0.1% of trading value, which the Bank converts to about ¥2.46tn a year at market value. J-REIT sales stay at about ¥5bn a year.
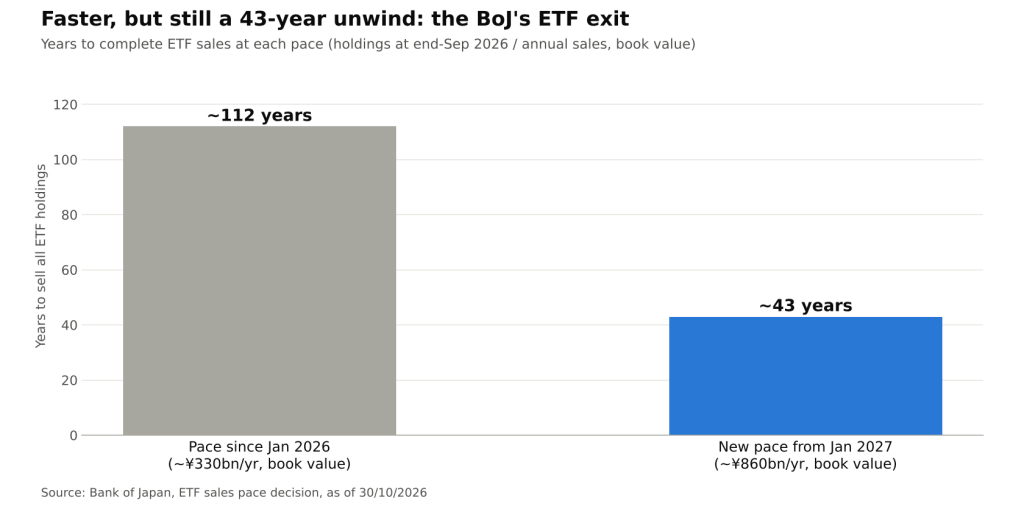
Years to complete ETF sales at the current and new pace, based on holdings at end-September 2026 (Bank of Japan @ 30/10/2026)
The Bank’s own arithmetic frames the scale. Dividing holdings at end-September 2026 by the annual sales amount gives an unwind horizon of about 112 years at the old pace and about 43 years at the new one. Both ratios imply book-value holdings of roughly ¥37tn. The step-up is about 2.6x, yet it still leaves the BoJ a structural holder of Japanese equities for decades.
The design choice is deliberate. Pegging sales to a small share of trading value is meant to keep the program from becoming a market event, and the BoJ retains the option to adjust or pause sales temporarily within the annual range. For equity investors, the relevant signal is less the flow, which is small relative to turnover, than the direction: balance-sheet normalization is now running on two tracks, rates and risk assets, at the same time.
What the Outlook Report Adds
The October Outlook Report gives the board’s reasoning for patience alongside clear upside price risks:
- Inflation forecasts stay above target. Median core CPI (less fresh food) is 2.5% for fiscal 2026 and 2.6% for fiscal 2027, before easing to 2.0% in fiscal 2028. Excluding energy as well, the path is 2.4%, 2.7% and 2.3%.
- Growth is soft. Real GDP growth is projected at 0.7% in fiscal 2026 and 2027 and 0.8% in fiscal 2028, which gives the majority a reason to move slowly.
- Risks are skewed to the upside on prices. The Bank lists higher crude oil prices and yen depreciation among the upside factors and flags the risk that medium- to long-term inflation expectations drift higher.
- Fiscal policy is a wildcard. The projections exclude the effect of a proposed cut to the consumption tax on food and beverages, a reminder that fiscal decisions could shift both measured inflation and the term premium.
Read together, the forecasts describe a central bank that judges underlying inflation to be roughly at target, sees risks tilted higher, and still prefers to wait. That combination is exactly what keeps the real policy rate negative and the yen soft.
Implications Across Markets
- Yield differentials are an incomplete yen model. A narrowing 10-year spread has not been a reliable signal of yen strength in this cycle. Analysts may get more from short-rate and real-rate differentials.
- The yen feeds back into BoJ policy. Because the Bank names currency weakness as an upside price risk, further depreciation raises the odds that the Takata view gains support at upcoming meetings.
- JGB volatility is a global duration story. A 3% JGB changes the hedged comparison for Japanese investors weighing domestic bonds against foreign ones, a channel that can matter for global term premia.
- Equity supply is a slow drip, not a wave. At about 0.1% of trading value, ETF sales are unlikely to drive index levels on their own, but they remove a long-standing backstop.
Conclusion
The BoJ’s October meeting combined a cautious rate hold with a faster but still very gradual ETF exit. The more telling story is in the markets: the US–Japan 10-year spread has roughly halved from its 2023 peak while the yen has weakened. That points to negative real short rates and term-premium pressure, not long-end yields, as the forces driving the currency.
What to watch next: the Summary of Opinions due on 10 November for how many members lean toward Takata’s view, the yen’s path relative to the BoJ’s stated upside price risks, any decision on the proposed food consumption-tax cut, and the December policy meeting.
Sources: Bank of Japan, Statement on Monetary Policy (30 Oct 2026); Bank of Japan, Change in the Pace of Sales of ETFs (Oct 2026); Bank of Japan, Outlook Report (Oct 2026); FRED: GS10, IRLTLT01JPM156N, EXJPUS, DEXJPUS.
Daniel Panizo, CFA, FMVA



Leave a Reply