
With 60% of the S&P 500 through its third-quarter reports, the scorecard looks contradictory. By count, this is a strong season: 82% of companies have beaten consensus EPS estimates, above the five-year average of 78% and the ten-year average of 77%. By size, it is the weakest in years: in aggregate, reported earnings are only 1.9% above estimates, against a five-year average of 7.5% and a ten-year average of 8.0%. If that holds, FactSet notes it would be the smallest aggregate beat since Q4 2022.
The two numbers measure different things, and the gap between them is the story of the quarter. The beat rate is an equal-weighted headcount; the aggregate surprise is dollar-weighted, so a handful of very large misses can offset hundreds of modest beats. In Q3 2026 the large misses came from the very top of the index, and that is quietly changing where the market’s earnings growth is coming from.
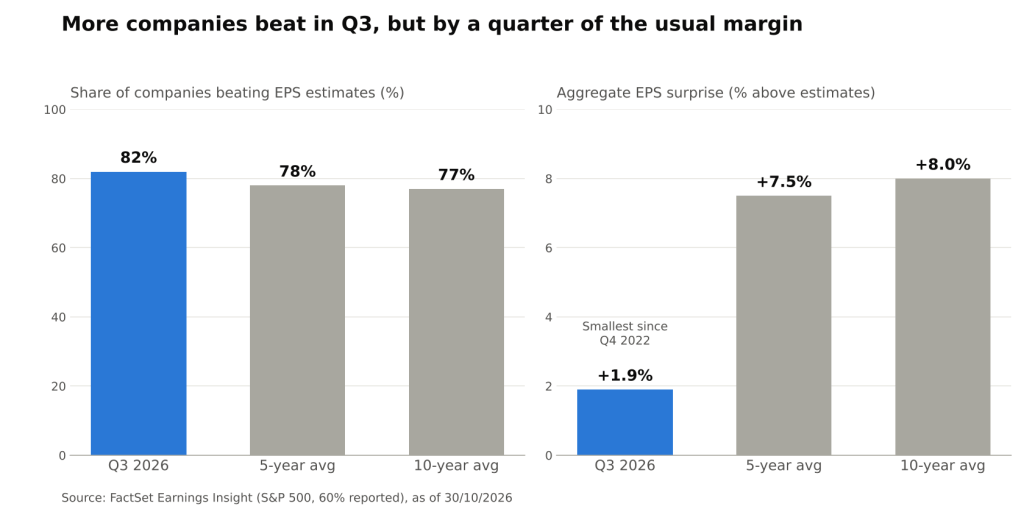
Share of S&P 500 companies beating EPS estimates and aggregate EPS surprise, Q3 2026 vs 5- and 10-year averages (FactSet Earnings Insight @ 30/10/2026)
Headcount vs. Dollars: Why the Two Scorecards Diverged
The aggregate surprise compares the sum of reported earnings with the sum of estimates, i.e. it weights each company by the size of its profits. That makes it highly sensitive to the mega-caps. FactSet’s breakdown shows the mechanics clearly:
- The Magnificent 7 missed as a group. In aggregate, the seven reported earnings 14.7% below estimates, while the full index came in 1.9% above.
- Two GAAP items stand out. Meta reported EPS of $3.83 against a $6.54 estimate, after a $9.89 billion charge tied to a litigation agreement. Alphabet reported $2.12 against $3.02, after an $8.7 billion loss in other income from net losses on equity securities.
- Communication Services absorbed the hit. The sector’s aggregate surprise is -21.5%, the largest negative of any sector, and its blended growth rate has dropped to 20.5% from 51.5% on 30 September.
- The positive surprises came from elsewhere. Health Care (+13.2%) and Energy (+8.8%) were the largest positive contributors at the sector level.
An important detail is the accounting basis. Alphabet, Amazon and Meta are measured on a GAAP basis for both surprise and growth, because most analysts estimate them that way. One-off charges and mark-to-market losses on equity stakes therefore flow straight into the index-level numbers rather than being adjusted out, as they would be in an “operating” EPS series. The weak aggregate surprise is partly a statement about earnings quality at the top of the index and partly an artifact of that measurement choice.
The 493 Take the Lead
The more durable consequence shows up in growth rates. On 30 September, analysts expected the Magnificent 7 to grow Q3 earnings by 33.6%, comfortably ahead of 27.8% for the other 493 companies. One month later the order has flipped: the blended rate (actual results for reporters, estimates for the rest) is 22.6% for the seven and 32.6% for the 493. The 493 now lead by 10.0 percentage points, a 15.8-point swing from a 5.8-point deficit.
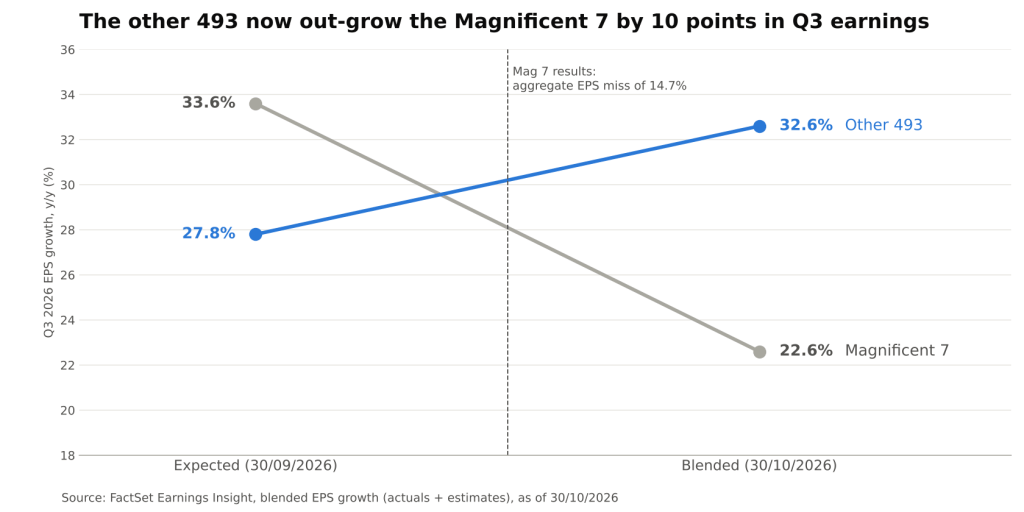
Q3 2026 blended EPS growth, Magnificent 7 vs other 493 S&P 500 companies, 30/09/2026 vs 30/10/2026 (FactSet Earnings Insight @ 30/10/2026)
Headline growth has barely noticed. Blended S&P 500 EPS growth stands at 30.2%, up from 29.1% on 30 September and far above the five-year average of 13.3%. Revenue growth of 13.4% is likewise well above its 8.3% five-year average. The index total is intact; its composition is not.
Where the Broader Growth Is Coming From
The breadth is real, but it is not evenly distributed. Three drivers stand out:
- Energy, on the oil price. The sector’s blended EPS growth is 146.4%, up from 114.4% at quarter-end and the highest of the 11 sectors. FactSet attributes this to crude: the average oil price in Q3 2026 was $85.68, about 32% above the $64.97 average a year earlier.
- Semiconductors, inside Technology. IT is growing EPS at 67.5%, but excluding the semiconductor industry the sector’s growth falls to 27.2%. Much of the sector’s strength is concentrated in chipmakers rather than spread across software and hardware.
- Cyclicals. Materials (30.6%) and Industrials (20.4%, up from 14.6% at quarter-end) are contributing meaningfully, while defensives lag: Financials at 5.5% and Health Care at 3.8%.
This matters for interpretation. Earnings breadth driven by a commodity price and a single industry is more cyclical than breadth driven by broad margin expansion. On margins, the picture is mixed: the Q3 net profit margin of 14.9% is above the 13.0% of a year ago and the five-year average of 12.6%, but below the record 17.0% posted in Q2.
What It Means for Valuation
The rotation in earnings leadership has coincided with a modest de-rating. The forward 12-month P/E of the S&P 500 is 18.7, down from 19.0 on 30 September and below both its five-year (19.8) and ten-year (19.1) averages. Three implications follow for analysts:
- Read surprises at two levels. A high beat rate with a low aggregate surprise signals that the typical company is executing while the largest weights are not. Index-level EPS can disappoint even in a broadly healthy season.
- Separate GAAP noise from run-rate earnings. Litigation charges and equity-security losses depress reported EPS without necessarily changing cash generation. For valuation work, normalizing these items matters more when they sit in the index’s largest constituents.
- Check the durability of the drivers. If Energy and semiconductors carry much of the growth, their growth inherits the volatility of oil prices and the chip cycle. WTI spot was $103.37 on 27 October, per FRED, which supports Q4 energy earnings but also raises input costs for the rest of the index.
Conclusion
Q3 2026 is a season of broad beats and shallow surprises. The split traces largely to the Magnificent 7, whose aggregate 14.7% miss, driven in part by GAAP items at Meta and Alphabet, dragged the dollar-weighted surprise to 1.9% even as 82% of companies beat. The more lasting shift is in growth leadership: the other 493 are now expected to grow Q3 earnings by 32.6%, ten points ahead of the mega-caps.
What to watch next: whether the remaining reports confirm the 493’s lead, how much of Q4’s expected 28.4% EPS growth rests on Energy and semiconductors, and whether guidance stays constructive. So far only 40% of the 47 companies issuing Q4 EPS guidance have been negative, against a five-year average of 60%. With calendar 2027 growth expected at 16.3%, the question is whether the broadening can outlast the oil price.
Sources: FactSet, Earnings Insight (30 October 2026); FRED, Crude Oil Prices: WTI (DCOILWTICO).



Leave a Reply