
The U.S. Treasury’s November refunding statement left coupon auction sizes unchanged, but it edited one phrase that matters more than the numbers. Treasury now expects to hold nominal coupon and floating-rate note sizes steady “for the next several quarters,” having dropped the words “at least” from its guidance, according to Reuters. Analysts read “several” as roughly two quarters, which puts the first size changes in play for the first half of 2027. Primary dealers broadly expect the cuts to land on 20-year and 30-year bonds, with any increases concentrated in the 2- to 7-year sector and possibly the 10-year.
The timing is awkward on the surface. Ten- and 30-year yields hit their highest levels since 2002 in October, and the debt outstanding has grown from about $14 trillion to $33 trillion over the past decade. Yet the Treasury’s own par-curve data show that the 2026 selloff has not been a long-end event. Since 2 January the 2-year yield has risen 114bp, against 46bp for the 30-year. Moving supply toward the front of the curve therefore shifts issuance into the sector that has repriced the most, while easing pressure on the segment where investors absorb the most duration risk.
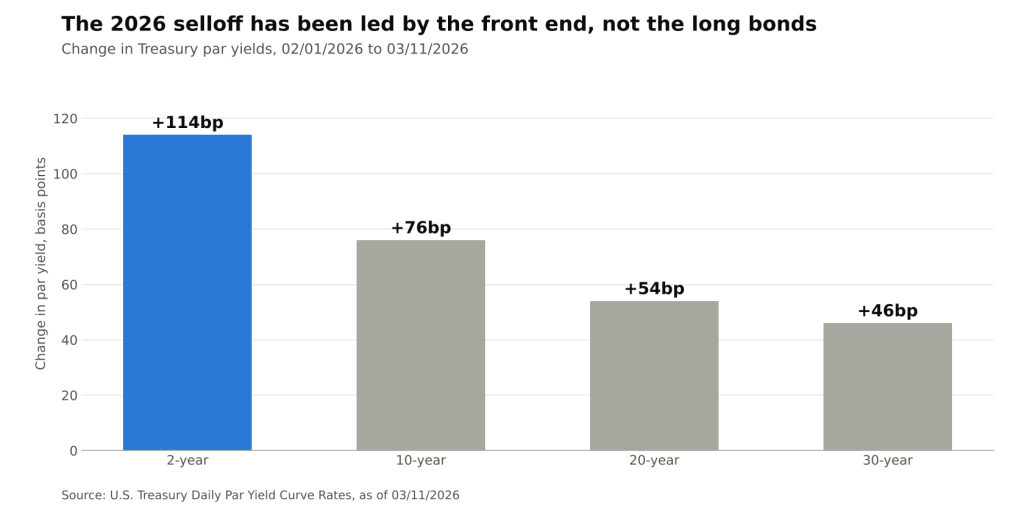
Change in Treasury par yields by tenor, 2 January to 3 November 2026 (U.S. Treasury Daily Par Yield Curve Rates @ 03/11/2026)
What the Refunding Actually Changed
The statement combined steady headline sizes with several structural tweaks. As reported by Reuters on 4 November:
- Refunding size: $125 billion next week, split into $58 billion of 3-year notes, $42 billion of 10-year notes and $25 billion of 30-year bonds.
- Guidance: removal of “at least” from the forward guidance on coupon and FRN sizes, i.e. the commitment to steady sizes now has a visible end date rather than an open-ended floor.
- 7-year calendar: the 7-year note moves to a quarterly new issue with two reopenings, a change that concentrates liquidity in fewer, larger lines.
- Buybacks: up to $70 billion of liquidity-support purchases across the curve, with Treasury still evaluating changes such as higher maximum purchase amounts.
- Bills: smaller bill auctions in December and larger ones across the bill curve in January, reflecting seasonal fiscal outflows.
Not everyone reads the timeline the same way. BNP Paribas, quoted by Reuters before the statement, saw nothing before August 2027 at the earliest. The gap between “first half of 2027” and “August 2027 or later” is the main source of uncertainty in the near-term supply outlook.
A Selloff the Long End Did Not Lead
The curve’s shape explains why a long-end cut is not simply a response to a long-end tantrum. On 2 January 2026 the 2-year par yield stood at 3.47%, the 10-year at 4.19% and the 30-year at 4.86%. By 3 November the same tenors were at 4.61%, 4.95% and 5.32%. That is a bear flattening, i.e. yields rising across the curve but fastest at the short end, which typically reflects repricing of the policy-rate path rather than a jump in compensation for holding long duration.
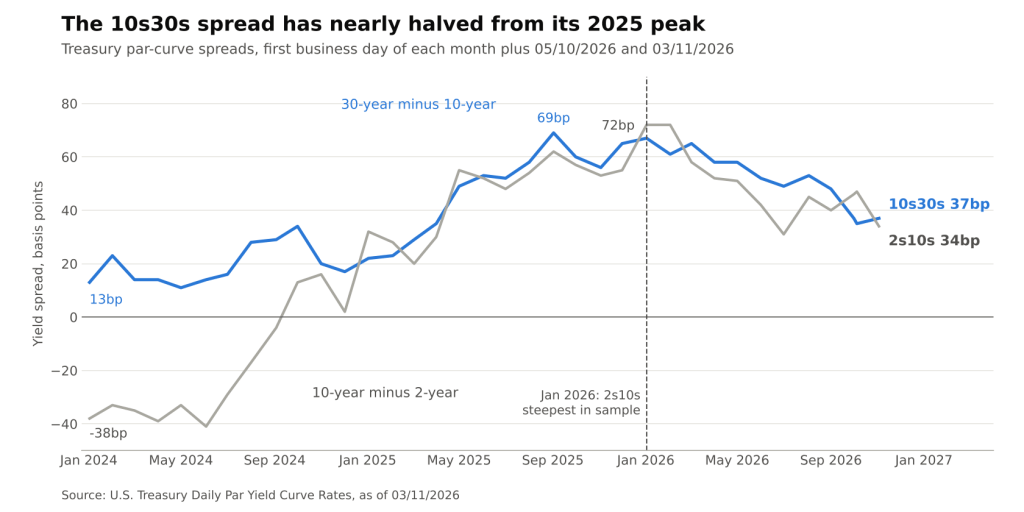
30-year minus 10-year and 10-year minus 2-year Treasury par-curve spreads, January 2024 to November 2026 (U.S. Treasury Daily Par Yield Curve Rates @ 03/11/2026)
The spread data make the point more directly. The 10s30s spread, i.e. the 30-year yield minus the 10-year, reached 69bp on 2 September 2025, the widest month-start reading in the sample, and was 67bp at the start of 2026. It stood at 37bp on 3 November. The 2s10s spread compressed from 72bp to 34bp over the same ten months. Even at the October peak, when the 10-year reached 5.31% on 5 October, 10s30s was only 35bp.
The 20-year point tells a similar story. In January 2024 the 20-year yielded 17bp more than the 30-year, a kink widely attributed to heavy supply relative to demand at that maturity. By 3 November the 20-year traded just 3bp above the 30-year (5.35% versus 5.32%). A cut in 20-year issuance would arrive after much of that cheapness has already corrected. Model estimates point the same way: the Kim-Wright 10-year term premium, a Federal Reserve estimate of the extra yield investors demand for duration risk, was 0.91% on 30 October, positive but not by itself evidence of a long-end buyers’ strike.
The Mechanics of Shortening Issuance
Trimming 20s and 30s while adding 2s to 7s changes more than the auction calendar. Four channels matter:
- Duration supply. A dollar of 30-year issuance carries several times the interest-rate risk of a dollar of 2-year issuance. Shifting the mix lowers the total duration the private sector must absorb, which in principle compresses the term premium at the long end even if gross borrowing is unchanged.
- Rollover exposure. Shorter issuance means debt reprices sooner. With the 2-year at 4.61%, a front-loaded mix ties Treasury’s interest bill more closely to the policy-rate path, the very part of the curve that has moved most this year.
- Bill share. Wells Fargo expects bills to settle near 24% of marketable debt over the medium term, above the post-war average of about 23% and well above the 15%-20% range recommended by the Treasury Borrowing Advisory Committee. TD Securities projects $678 billion of net bill supply from November to January. Shifting coupons to the belly is one way to stop the bill share drifting higher without adding long duration.
- Buybacks as a complement. Liquidity buybacks of up to $70 billion let Treasury retire older, less liquid long bonds, effectively reducing long-end float alongside any cut in new 20- and 30-year supply.
The trade-off is the classic debt-management one: lower expected cost and less long-end pressure today in exchange for more sensitivity to short rates tomorrow. With an FY2026 deficit of $1.992 trillion, the size of the borrowing need makes that trade-off more consequential than in past cycles.
Scenarios for 2027
- Early, modest cuts (H1 2027): small reductions in 20- and 30-year sizes, offset by increases in 2- to 7-year notes. The likely market effect is incremental support for long-end spreads versus the belly rather than a shift in overall yield levels.
- Delayed changes (August 2027 or later): bills continue to absorb the deficit, the bill share drifts further above the TBAC range, and front-end supply becomes the main pressure point.
- Policy-driven reversal: if the front end continues to lead and the curve inverts again, the cost advantage of short issuance shrinks, weakening the case for terming in and complicating the 2027 plan.
Conclusion
Dropping two words from the refunding guidance turned a standing commitment into a countdown. The direction dealers expect, i.e. fewer 20- and 30-year bonds and more 2- to 7-year notes, would reduce duration supply at a time when the long end is no longer the stress point of the curve: since January the 2-year has risen 114bp, the 30-year 46bp, and 10s30s has nearly halved from its 2025 peak.
The items to watch are the February 2027 refunding statement for the first explicit size changes, the dealer survey responses on long-end cuts, the bill share relative to the TBAC range, and whether 10s30s keeps compressing before any supply relief arrives. If the curve has already priced lighter long-end supply, the bigger 2027 risk sits in the belly, where new issuance is set to land.
Sources: U.S. Treasury, Daily Par Yield Curve Rates; U.S. Treasury, Quarterly Refunding Statement; Reuters, “US Treasury shifts language, opening door to auction size changes”; Reuters, “US Treasury auction changes loom in 2027”; FRED, THREEFYTP10.
Daniel Panizo, CFA, FMVA


Leave a Reply