
On 5 November the Bank of England raised Bank Rate by 25bp to 4.00%, its first increase since the tightening cycle peaked at 5.25% in August 2023. The vote was 8–1, and the lone dissent wanted more: Catherine Mann voted for 50bp, to 4.25%. The move came with UK CPI inflation at 3.5% in September and the Bank now projecting a rise to around 5% by the middle of 2027, driven largely by energy.
The decision matters beyond the UK because it breaks with the standard central-bank playbook for supply shocks, i.e. “look through” a temporary energy-driven jump in prices as long as expectations stay anchored. The ECB, facing euro area inflation of 3.8% in September, has kept its deposit rate at 2.50% (as of 04/11/2026). The more useful question is not whether the BoE was right, but what its own numbers say about how much the hike actually tightens policy.
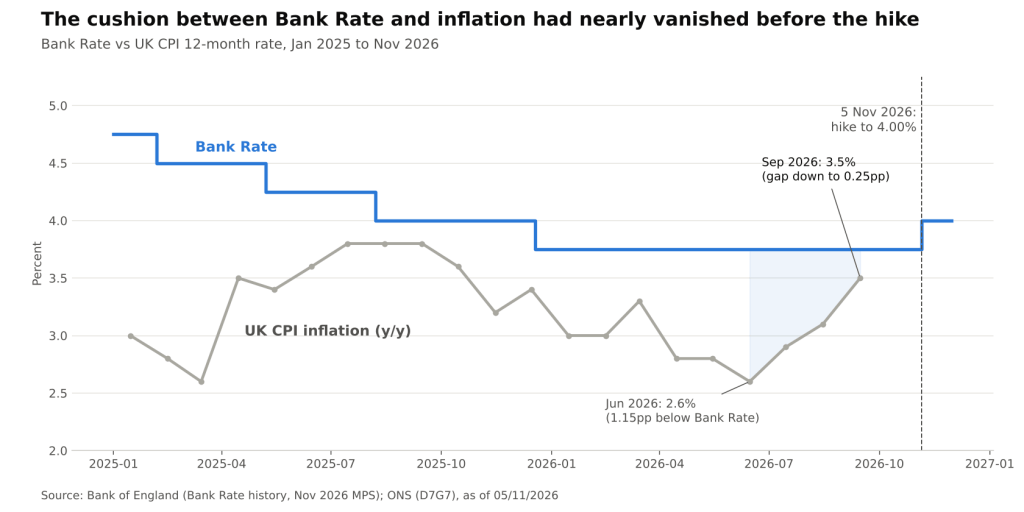
Bank Rate vs UK CPI 12-month rate, Jan 2025 to Nov 2026 (Bank of England, ONS @ 05/11/2026)
The Cushion That Disappeared
For most of 2026 Bank Rate sat at 3.75%, where it had been since the December 2025 cut, while CPI inflation drifted down to 2.6% in June. That left a backward-looking real policy rate (Bank Rate minus current CPI) of about 1.15pp, a moderately restrictive stance. Three months later the picture had changed: CPI rose to 3.1% in August and 3.5% in September, compressing the gap to just 0.25pp without the MPC moving at all.
This is the mechanical problem a supply shock creates for a central bank on hold. Policy tightness is not set by the nominal rate alone but by the nominal rate relative to inflation, so a rate that is left unchanged during an energy spike passively eases. The November hike restores only part of what was lost: against September CPI, the post-hike gap is 0.50pp, still well under the June level.
Why the BoE Did Not Look Through
The minutes attribute around 1pp of September’s 3.5% directly to energy, mostly fuels. Over the 15 working days to 27 October, Brent averaged $108 a barrel and UK front-month gas 216p per therm, 38% and 81% above the levels assumed in the July Report. On its own, that profile is the textbook case for patience. Several details in the September data and the minutes explain why the majority chose otherwise:
- Inflation is broadening beyond energy. Services CPI rose from 3.4% to 3.7% in September and core CPI (excluding energy, food, alcohol and tobacco) from 2.6% to 2.8%. Goods inflation also climbed, from 2.7% to 3.2%.
- Domestic disinflation has stalled. Members described underlying wage growth as stuck around 3.5%, services inflation as flat since spring, and private-sector wage growth as having stopped declining. Pay growth of 3.5% sits well above what is usually consistent with a 2% target.
- The starting point is not 2%. UK CPI has not printed below 2.6% at any point since January 2025. An energy shock that lands on inflation already above target raises the risk that firms and workers treat higher prices as the norm.
- The peak keeps moving up. The near-term projection is about 1¼pp higher than in the July Report, with CPI around 4½% in 2027 Q1 and around 5% in Q2.
The minutes note limited evidence so far of second-round effects, i.e. wages and prices reacting to past inflation. The hike is therefore pre-emptive: it is aimed at the risk of second-round effects rather than at evidence that they are already under way.
Forward-Looking, the Policy Rate Is Still Negative
The backward-looking measure flatters the stance. Comparing Bank Rate with the inflation the BoE itself expects gives a rough ex-ante real rate, and on that basis 4% does not look restrictive at the peak. Holding Bank Rate flat at 4.00%, the gap is about -0.50pp against projected 2027 Q1 inflation and about -1.00pp against Q2. Had the MPC stayed at 3.75%, those figures would have been -0.75pp and -1.25pp.
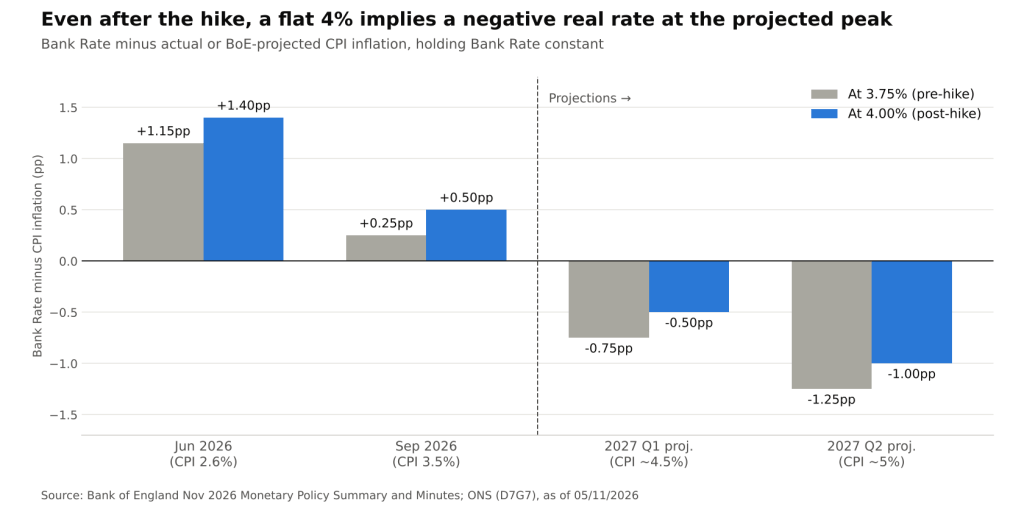
Bank Rate minus actual or BoE-projected CPI, holding Bank Rate constant (Bank of England, ONS @ 05/11/2026)
Two caveats keep this from being a simple “behind the curve” story. First, headline CPI at the peak will be inflated by energy that the Bank expects to fade, so a negative real rate against peak headline inflation overstates how loose policy is against underlying inflation. Second, the transmission is already visible: benchmark two-year mortgage rates had risen by nearly 50bp since the start of September, before the hike was delivered. Because many UK mortgages are fixed for short periods, that repricing passes through to households relatively quickly.
Even so, the arithmetic explains why the committee left the door open. Several members signaled that further increases were likely, while one argued that the next move could be in either direction. The Bank’s Market Participants Survey median puts Bank Rate at 4.25% by February, and the minutes note that survey path sits below the short-term rate curve, i.e. market pricing implies somewhat more tightening than the surveyed participants expect.
Implications for Gilts and Sterling Credit
- Front-end sensitivity. With guidance explicitly data-dependent and the committee split on the path, the two-year gilt is likely to stay highly sensitive to each CPI and wage release, starting with October CPI on 18 November and the 17 December MPC decision.
- Policy divergence. The gap between Bank Rate and the ECB deposit rate is now 1.50pp (4.00% vs 2.50%), despite euro area headline inflation running higher than the UK’s in September. That divergence rests on the UK’s weaker domestic disinflation, not on the size of the energy shock.
- Floating-rate borrowers. Leveraged and mid-market borrowers paying SONIA-linked coupons face higher cash interest just as energy costs squeeze margins, a combination that tends to show up first in interest coverage ratios.
- Balance sheet. The stock of gilts held for monetary policy purposes stood at £362bn on 4 November. Any change to the pace at which those holdings run off would affect gilt duration supply on top of the rate path.
Conclusion
The BoE’s hike to 4.00% is best read as an attempt to stop policy from easing by default. A flat Bank Rate during the energy spike had cut the real-rate cushion from about 1.15pp in June to 0.25pp in September, and against the Bank’s own projections a 4% rate would still be negative in real terms at the mid-2027 peak. The case for moving now rests on sticky services inflation and wage growth, not on energy itself.
What to watch: October CPI on 18 November, especially services and core; evidence on pay settlements; whether energy prices stabilize enough to cap the projected 5% peak; and the 17 December decision, where the split between members leaning toward further hikes and those warning against a full cycle will be tested.
Sources: Bank of England, Monetary Policy Summary and Minutes, November 2026; Bank of England, Bank Rate history; ONS, CPI annual rate (D7G7); ONS, Consumer price inflation, September 2026; FRED, ECB Deposit Facility Rate (ECBDFR); Eurostat, euro area flash inflation, September 2026.
Daniel Panizo, CFA, FMVA



Leave a Reply