
US investment-grade issuance has already set an annual record. LSEG data reported by Reuters on 6 November show $1.88 trillion of high-grade corporate bonds sold in 2026 through 4 November, edging past the $1.86 trillion set in 2020, with roughly eight weeks of the year still to run. The five hyperscalers (Amazon, Alphabet, Meta, Microsoft and Oracle) account for more than $370.7 billion of that total, about one-fifth of the market.
The headline volume is well known. Less discussed is where the supply is landing in the rating stack. A large share of the jumbo technology paper comes from issuers rated well above the BBB base of the market (Meta’s latest deal, for example, carries Aa3/AA- ratings), and the spread data are consistent with that supply weighing on the top tier. Since the end of September 2025, the ICE BofA AA US Corporate option-adjusted spread (OAS, i.e. the yield premium over Treasuries after stripping out embedded options) has widened by 26bp, from 43bp to 69bp as of 5 November 2026. The BBB index widened by only 19bp over the same window, from 97bp to 116bp.
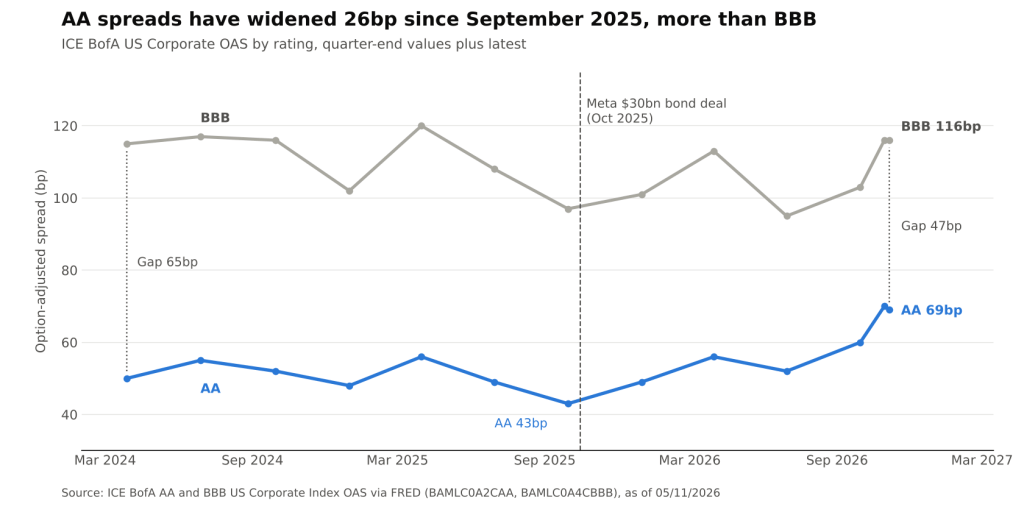
AA and BBB US corporate option-adjusted spreads at quarter-ends since March 2024, plus latest (ICE BofA via FRED @ 05/11/2026)
The Quality Premium Is Shrinking From the Top
The usual pattern in a widening phase is that lower-rated credit leads. That is not what the last thirteen months show. Measured in basis points, the gap between BBB and AA spreads has narrowed from 65bp at the end of March 2024 to 47bp today. It was 54bp at the end of September 2025, around the start of the jumbo technology deal wave, and fell to 43bp by mid-2026.
The ratio view is more telling, because spread levels drift with the overall market. Through 2024 and the first three quarters of 2025, the AA spread consistently sat at 43-47% of the BBB spread. That share has climbed every quarter since, to 58% at the end of September 2026 and about 60% now. In other words, investors are demanding proportionally more compensation for owning AA credit than at any point in the period, even though default risk at that rating remains remote.
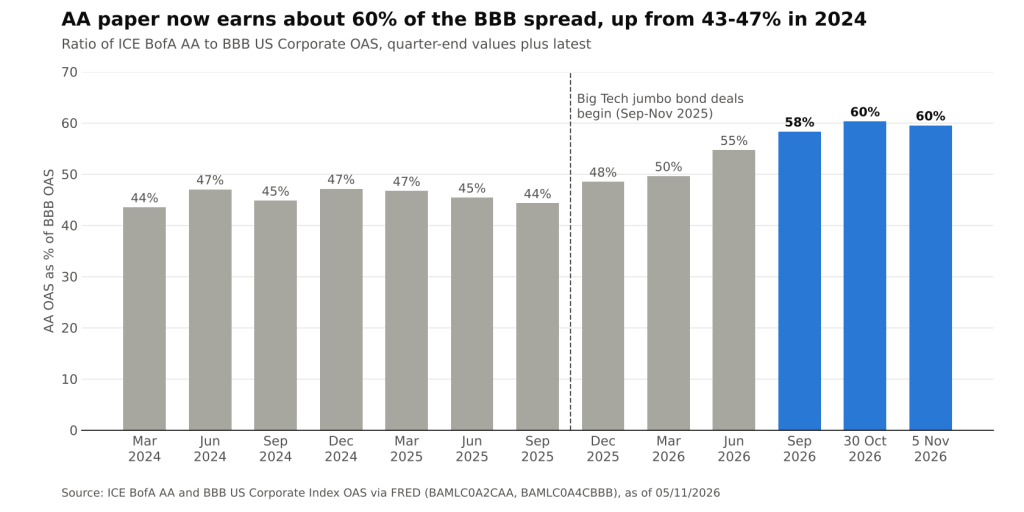
AA OAS expressed as a percentage of BBB OAS, quarter-ends since March 2024, plus latest (ICE BofA via FRED @ 05/11/2026)
Why Supply Hits the AA Bucket Hardest
A rating bucket is a pool of bonds that dedicated buyers hold against benchmarks. When a small number of issuers add size quickly, the pricing of the whole bucket can shift. Three mechanics are at work:
- Concentration. Single deals have become enormous. Meta’s $30 billion in October 2025, and Alphabet’s $17.5 billion and Amazon’s $15 billion in November 2025, each dropped a large block of paper into the upper tiers of the index at once. Benchmark-aware investors must absorb that weight, and the concessions needed to clear new issues tend to reset secondary levels for comparable bonds.
- Duration mix. Recent hyperscaler deals have included very long maturities, such as Meta’s 2065 euro notes discussed below. OAS is quoted per bond, not per year of duration, so an index that adds more 30- and 40-year paper mechanically carries a wider average spread, even if issuer credit quality is unchanged. Part of the AA move is therefore compositional rather than a pure repricing of risk.
- Issuer-specific risk creeping in. Reuters reports that Oracle’s five-year credit default swap spread reached a record 325.45bp in October, and that Amazon, Alphabet, Nvidia and Meta CDS also hit records, albeit at lower levels. When a handful of names dominate a bucket, their idiosyncratic news starts to move the index.
A Live Example: Meta’s Euro Curve
Meta’s six-tranche, €9 billion euro deal priced on 4 November 2026 illustrates how investors are charging for term. According to the SEC pricing term sheet, the notes carry Aa3 (Stable) and AA- (Negative) ratings from Moody’s and S&P. Spreads to mid-swap rose from +103bp on the 2031 notes to +333bp on the 2065 notes, a 230bp increase along the curve.
| Maturity | Coupon | Size (€bn) | Spread to mid-swap (bp) | Spread to Bund (bp) |
|---|---|---|---|---|
| 2031 | 4.300% | 1.75 | +103 | +129.0 |
| 2033 | 4.650% | 1.25 | +135 | +152.6 |
| 2035 | 4.900% | 1.00 | +160 | +172.0 |
| 2038 | 5.400% | 1.75 | +203 | +201.6 |
| 2044 | 6.050% | 1.75 | +263 | +241.5 |
| 2065 | 6.400% | 1.50 | +333 | +275.6 |
Meta Platforms euro senior notes priced 4 November 2026: tranche terms (Meta FWP pricing term sheet, SEC @ 04/11/2026)
A curve this steep for an AA-category issuer is a reminder that ratings measure default probability, not the price of absorbing very large amounts of duration from one borrower. Investors are lending more willingly at five years than at forty, and the extra spread at the long end is the price of that reluctance.
Implications for Portfolios
- Rating is a weaker proxy for spread behavior. AA exposure is no longer the low-beta (i.e. less sensitive to market moves) ballast it was in 2024. In a supply-driven phase, it can widen alongside or ahead of BBB.
- Benchmark concentration rises. As hyperscalers grow their share of index debt, passive and benchmark-hugging IG portfolios take on more single-sector exposure to AI capital spending, whatever their headline rating mix.
- The pipeline is not slowing. Goldman Sachs, cited by Reuters, expects bond issuance to fund about 35% of hyperscaler capital spending in 2027, roughly in line with 2026. If that holds, the supply pressure on top-tier spreads is a structural feature rather than a one-off.
- Relative value moves down the stack. With the BBB-AA gap at 47bp, compared with 65bp in early 2024, investors are being paid less than before to move down in quality. The case for doing so rests more on fundamentals than on spread pickup.
Conclusion
Record high-grade issuance has not widened spreads evenly. The AA bucket, where much of the jumbo technology supply lands, has repriced by 26bp since September 2025 against 19bp for BBB, and the AA spread now runs at about 60% of BBB, up from 43-47% through most of the past two years. Some of that is composition and duration, but the steady rise across four consecutive quarter-ends points to supply as a central driver.
The items to watch are the remaining 2026 calendar, the next round of hyperscaler capex guidance, and whether the AA-to-BBB ratio stabilizes once the pace of jumbo deals slows. A return toward the old 45% relationship would signal that the market has digested the supply; a move further toward parity would mean the quality premium is being redefined by a single sector.
Sources: ICE BofA AA US Corporate Index OAS (FRED, BAMLC0A2CAA); ICE BofA BBB US Corporate Index OAS (FRED, BAMLC0A4CBBB); Reuters, “Big Tech set to drive US corporate bond sales to annual record high, data shows” (6 November 2026); Reuters, “Alphabet’s debt raise fuels forecasts for record year in corporate bond sales” (9 February 2026); Meta Platforms pricing term sheet, SEC Form FWP (4 November 2026).
Daniel Panizo, CFA, FMVA



Leave a Reply