
On October 28 the Federal Reserve held the federal funds target range at 3.75%–4.00%, six weeks after a quarter-point hike on September 16 ended a nine-month pause. The vote was 10–2, and both dissenters, Lisa Cook and Beth Hammack, wanted another 25bp increase immediately. The statement described activity as expanding at a strong pace and inflation as still elevated. On its face, that is a hawkish hold, and futures were reported to price a December hike at roughly 86% immediately after the decision.
The front end of the Treasury curve tells a more measured story. The 2-year yield peaked at 4.92% on September 28 and fell to 4.46% by November 5, a 46bp decline while the Fed was turning more hawkish, not less. Measured against the effective fed funds rate (EFFR), the 2-year premium has fallen from 104bp to 58bp, back below where it stood in early August, before the hike was even delivered. The market has not stopped expecting tightening, but it has stopped extrapolating it.
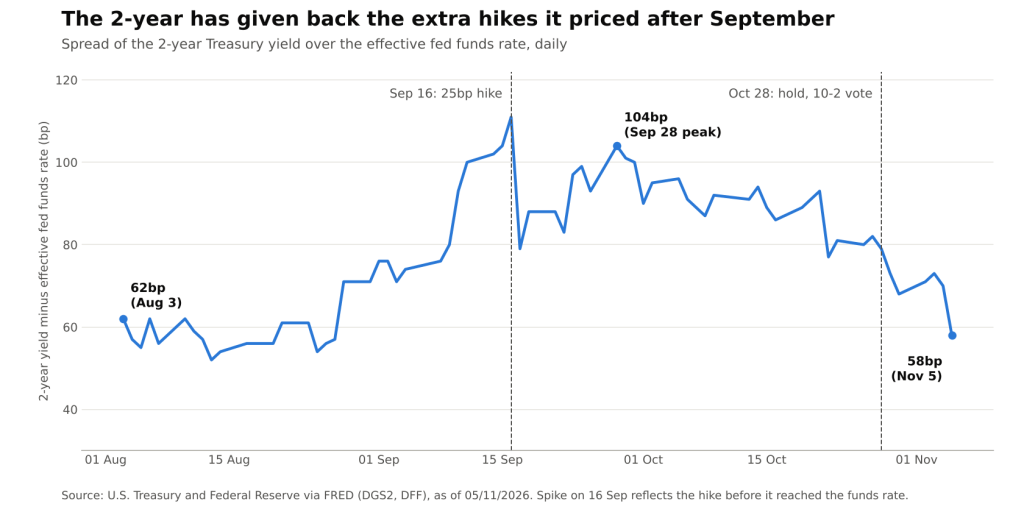
2-year Treasury yield minus effective fed funds rate, daily, in basis points (U.S. Treasury and Federal Reserve via FRED, DGS2 and DFF @ 05/11/2026)
Reading the 2-Year as a Policy Forecast
The 2-year yield is, to a first approximation, the market’s expected average policy rate over the next two years plus a small term premium (i.e. the extra compensation investors demand for locking in a fixed rate rather than rolling overnight funding). Subtracting the EFFR therefore gives a rough read of how much additional tightening, or easing, is embedded in the curve. It is an imperfect gauge, because the term premium moves too, but it is transparent and built entirely from daily official series.
Expressed in quarter-point steps and ignoring term premium, the gap of 104bp on September 28 was worth about four further hikes. The 58bp on November 5 is worth a little more than two. The more telling comparison is with early August. On August 3, with the EFFR at 3.63%, the 2-year traded at 4.25%, a 62bp premium. Since then the Fed has delivered 25bp and the 2-year has risen by 21bp. In other words, the policy path the market expects beyond the September hike is essentially where it was before the hike happened. All of the extra tightening priced in late September has been unwound.
How the Front End Got Ahead of the Fed
The longer view shows why the September move was not a surprise to bond markets. The 2-year bottomed at 3.47% in early January 2026, when the EFFR sat at 3.64% following three cuts in late 2025. From the spring onward, the 2-year climbed steadily while the funds rate stayed flat, crossing 4% by June and reaching 4.25% in early August. By the time the Committee acted, the front end had already priced the hike and more.
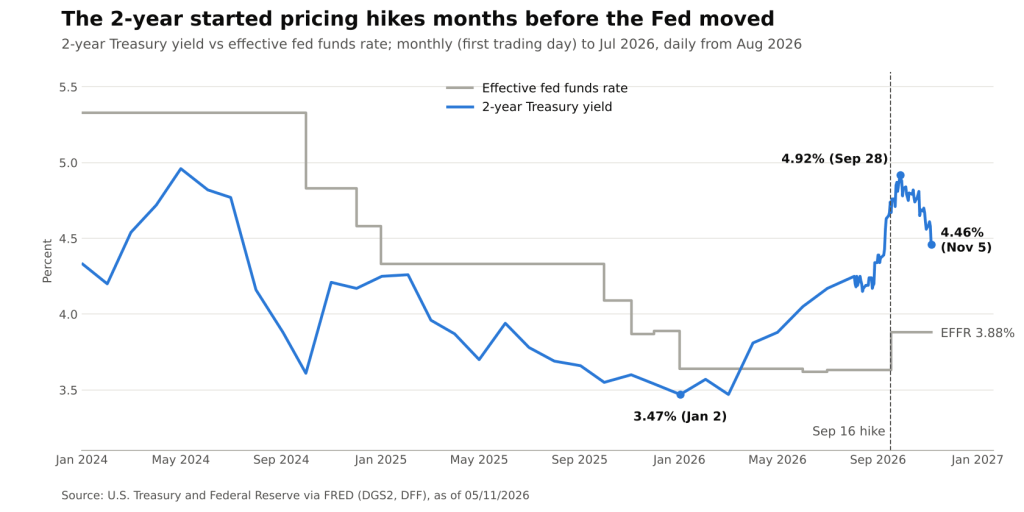
2-year Treasury yield vs effective fed funds rate; monthly to July 2026, daily from August 2026 (U.S. Treasury and Federal Reserve via FRED, DGS2 and DFF @ 05/11/2026)
The overshoot came in the weeks around the decision. Between September 9 and September 28 the 2-year rose from 4.43% to 4.92%, as the market treated the first hike as the start of a cycle rather than a calibration. That pricing has faded in stages since: a sharp drop on October 22, a further leg after the October hold and a 12bp one-day fall on November 5.
Why a Hawkish Hold Did Not Lift the Front End
Several mechanics explain how a 10–2 vote with two hawkish dissents coincided with lower 2-year yields:
- Dissents were about timing, not destination. Two votes for an immediate hike signal that a December move is likely, which the market had already priced. They say little about how far the cycle runs once the next step is taken.
- The statement kept a data-dependent bias. The Committee tied further adjustments to incoming information on its path back to the 2% goal, without signalling a sequence of moves. Absent explicit guidance, the market prices the next hike and discounts the ones after it.
- Pricing gets pulled forward, then capped. When a hike is close to fully priced, more hawkish news has limited upside for the 2-year, while any softer data compresses the tail of the path. That asymmetry is visible in the post-meeting drift lower.
- Long yields fell in step. The 10-year declined from 5.05% on October 28 to 4.84% on November 5, the same 21bp as the 2-year. A parallel rally points to a broad repricing of rate expectations rather than a flight to the front end alone.
What the Curve Shape Adds
The spread between the 10-year and 2-year yields stood at 38bp on November 5, unchanged from FOMC day and slightly above the 32bp of late September. A positively sloped curve during a hiking phase suggests that investors still demand compensation for duration, consistent with the 10-year having reached 5.31% on October 5, its 2026 high, even as they trim the expected length of the tightening phase.
For fixed-income portfolios, the implications are practical rather than directional:
- Front-end carry is less exposed to a December hike. With the 2-year about 58bp over the EFFR, a single 25bp move is already well inside the yield. The risk for short-duration holdings lies in a path that extends well beyond December, not in the next decision.
- The policy path is now the swing factor. A run of firm inflation prints would push the gap back toward the September peak quickly, because the market has shown it will extrapolate. A softer run would test how much of the remaining premium is term premium rather than expected hikes.
- Reference rates move with the funds rate, not the curve. Floating-rate borrowers tied to overnight benchmarks have already absorbed the September hike and face the December decision directly, regardless of the 2-year rally.
Conclusion
The front end has made a round trip. After pricing roughly four further hikes in late September, the 2-year now embeds a little more than two quarter-point moves over the funds rate, roughly the same expected path beyond September that it carried in early August. A hawkish hold with two dissents did not change that, because it confirmed the next step without committing to the ones after it.
The next tests are the October CPI release on November 10 and the December 9 FOMC decision. The signal to watch is not whether the Fed hikes in December, which is largely priced, but whether the 2-year/EFFR gap rebuilds above 80bp after it does. That would mark a return to extrapolation; a gap that compresses further after a December hike would indicate the market sees the cycle ending.
Sources: Federal Reserve, FOMC statement (28/10/2026); FRED, 2-Year Treasury Constant Maturity (DGS2); FRED, Effective Federal Funds Rate (DFF); FRED, 10-Year Treasury Constant Maturity (DGS10); FRED, Federal Funds Target Range Upper Limit (DFEDTARU); IndraStra, post-meeting market pricing (29/10/2026).
Daniel Panizo, CFA, FMVA


Leave a Reply