
For most of 2026, stress in U.S. high yield was a story about one rating bucket. The ICE BofA CCC & Lower option-adjusted spread (OAS, i.e. the yield premium over Treasuries after adjusting for embedded call options) widened from 8.88% on 2 January to 10.75% on 22 September, while the BB index actually tightened. Since late September the picture has changed. The CCC spread peaked at 13.56% on 23 October, the highest reading in the FRED data available since January 2024, and stood at 13.20% on 5 November. Over the same span the BB spread climbed from 1.56% to 2.13%.
That shift matters more than the headline CCC level. When only the weakest credits reprice, the market is sorting idiosyncratic losers from the rest. When the better-rated tiers start to move with them, the repricing is about the asset class: risk appetite, fund flows and the cost of capital for every leveraged borrower. The ratio of the CCC spread to the BB spread captures that transition cleanly.
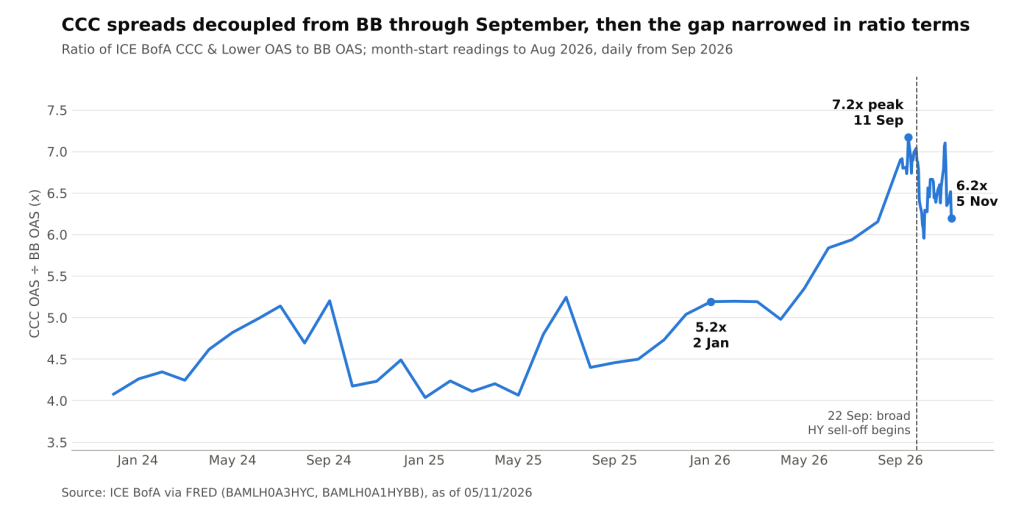
Ratio of the ICE BofA CCC & Lower US High Yield OAS to the BB US High Yield OAS; month-start readings to August 2026, daily thereafter (ICE BofA via FRED @ 05/11/2026)
Phase 1: Decompression Without Contagion
Between 2 January and 22 September the three ICE BofA indices told very different stories:
- CCC & Lower: widened 187bp, from 8.88% to 10.75%.
- BB: tightened 15bp, from 1.71% to 1.56%, after touching 1.50% on 11 September, matching its lowest level since at least January 2024.
- Broad high-yield index: also tightened 15bp, from 2.83% to 2.68%.
This is textbook decompression, i.e. the spread between rating tiers widening even as the average looks calm. Investors were content to own BB paper near the tightest levels in the data while demanding a steadily larger premium to hold the lowest-rated names. The CCC-to-BB ratio rose from 5.2x in January to a peak of 7.2x on 11 September. In basis-point terms, the gap between the two tiers widened from 717bp to 919bp by 22 September.
A pure decompression phase usually reflects issuer-specific problems: stretched capital structures, maturities that cannot be refinanced at today’s coupons, or sectors facing structural disruption. The aggregate index masks this because the CCC bucket is a small share of the market. A tightening headline spread can coexist with a sharp deterioration in the tail, which is why the broad high-yield OAS was a poor guide to credit risk for most of the year.
Phase 2: The Repricing Broadens
From 22 September the dynamic flipped. Between that date and 5 November:
- CCC & Lower widened a further 245bp, to 13.20%, a 22.8% increase in the spread.
- BB widened 57bp, to 2.13%, a 36.5% increase.
- The broad index widened 80bp, to 3.48%, a 29.9% increase.
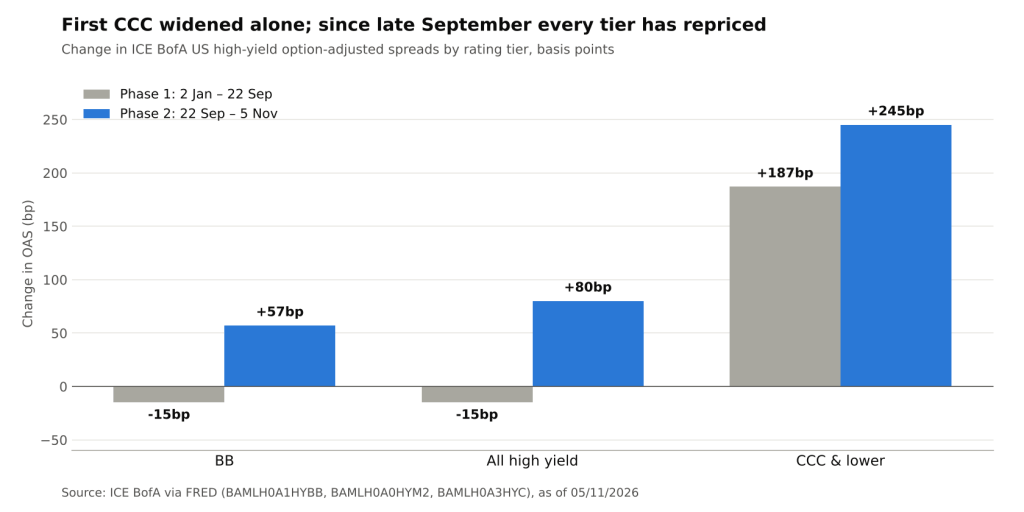
Change in ICE BofA US high-yield OAS by rating tier, 2 January–22 September vs 22 September–5 November 2026 (ICE BofA via FRED @ 05/11/2026)
In absolute terms CCC still did the most damage. In proportional terms, which is how spread risk tends to scale across ratings, the better-quality tier moved the most. That is why the CCC-to-BB ratio fell back to 6.2x on 5 November even as the CCC spread sat near its highs. The ratio has been volatile day to day, but its direction since mid-September points to a market repricing high yield as a whole rather than isolating a handful of distressed borrowers.
The last two weeks reinforce the point. Since the CCC peak on 23 October, the CCC spread has eased 36bp, while the BB spread is 7bp wider and the broad index 10bp wider. Stress at the bottom is plateauing; stress higher up is still building. Press coverage has linked part of October’s risk-off move to concerns over heavy AI-related borrowing and wider credit default swap levels for large technology issuers, which helps explain why the pressure is no longer confined to weak balance sheets.
Where the Tiers Sit Against the 2025 Shock
The April 2025 tariff sell-off provides a useful benchmark because it was a broad, macro-driven repricing. Comparing today’s levels with that episode shows how uneven the current stress remains:
- CCC & Lower: the 23 October peak of 13.56% is the highest level in the FRED data since January 2024, above anything reached during the 2025 shock.
- BB: at 2.13%, still 93bp below its 7 April 2025 high of 3.06%.
- Broad index: at 3.48%, still 113bp below its 7 April 2025 high of 4.61%.
The bottom of the market has already priced a downturn more severe than 2025’s. The top of the market has not. That asymmetry is the core of the current setup: if the broadening seen since late September continues, the higher-rated tiers have far more room to move in basis-point terms relative to their own history than the CCC bucket does.
What the Shift Means for Credit Analysis
Several practical implications follow from the two-phase pattern:
- Index spreads understate tail risk. The broad OAS tightened for most of 2026 while the CCC tier widened by close to 200bp. Rating-tier spreads, and the ratios between them, carry information the headline figure averages away.
- The ratio is a regime signal. A rising CCC-to-BB ratio points to credit selection, where fundamentals of individual issuers drive returns. A falling ratio alongside wider spreads points to beta, where the whole asset class reprices on macro and liquidity factors.
- Refinancing costs are rising for better credits too. A 57bp move in BB spreads in about six weeks lifts the marginal funding cost for issuers that were borrowing near the tightest spreads in the data in September, which matters for upcoming maturities and leveraged buyout financing.
- Duration of spread matters. BB bonds tend to carry longer spread duration than CCC paper, so each basis point of widening costs more in price terms in the higher-quality tier.
Conclusion
U.S. high-yield stress in 2026 has come in two distinct phases. Through 22 September it was confined to the CCC tier, which widened 187bp while BB and the broad index tightened. Since then, every tier has repriced, and in proportional terms BB has moved the most, pulling the CCC-to-BB ratio down from 7.2x to 6.2x even as the CCC spread held above 13%.
The key question now is whether the broadening persists. Signals to watch include the direction of the CCC-to-BB ratio, whether BB spreads approach their April 2025 high of 3.06%, primary-market access for single-B and CCC issuers, and default and distressed-exchange data for October and November. A renewed rise in the ratio would suggest the market has returned to sorting individual credits; a further fall with wider spreads would confirm an asset-class repricing.
Sources: ICE BofA CCC & Lower US High Yield OAS via FRED (BAMLH0A3HYC); ICE BofA BB US High Yield OAS via FRED (BAMLH0A1HYBB); ICE BofA US High Yield OAS via FRED (BAMLH0A0HYM2); Naked Capitalism, “Junk Bond Market Starts to Crack” (2 November 2026).
Daniel Panizo, CFA, FMVA



Leave a Reply