
Electricity was the defining household cost of the Nov. 3 US midterms. Democrats won majorities in both the House and the Senate in an election where energy prices and data center backlash were central, and in Georgia voters handed Democrats a majority on the Public Service Commission, the body that sets Georgia Power’s rates. The political message is clear. The economic question for investors is more precise: what is actually pushing the bill up?
The intuitive answer, fuel, no longer fits the data. US electricity prices in the consumer price index rose 4.37% in the year to September 2026, ahead of 3.74% for all items, while Henry Hub natural gas, the marginal fuel for much of US generation, averaged $2.99/MMBtu in October, close to where it stood before the 2022 spike. Since September 2019, the electricity index is up 42.8% against 31.2% for the overall basket, i.e. a real (inflation-adjusted) increase of about 8.8%.
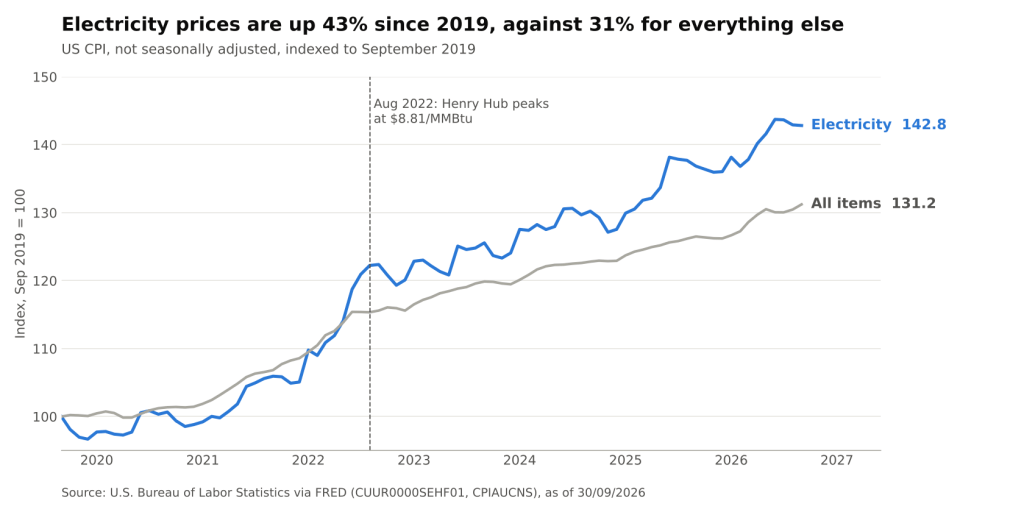
US electricity CPI vs all-items CPI, indexed to September 2019 (BLS via FRED @ 30/09/2026)
Fuel Is No Longer the Driver
Through 2022 electricity behaved like an energy commodity. Henry Hub peaked at $8.81/MMBtu in August 2022, and electricity CPI inflation hit 15.8% year on year the same month, as fuel-adjustment clauses (i.e. tariff riders that pass fuel costs straight to customers) did their job. When gas collapsed in 2023, electricity inflation cooled to a low of 2.1%, but prices never fell back.
Measured from September 2022, the gap is stark. Henry Hub is down 62.6%, from $7.88 to $2.95 in September 2026, while the electricity index is up 16.7%. Even the January 2026 spike to $7.72 left little lasting mark on the bill. The component that moved with gas has been replaced by components that do not move with anything except the regulatory calendar.
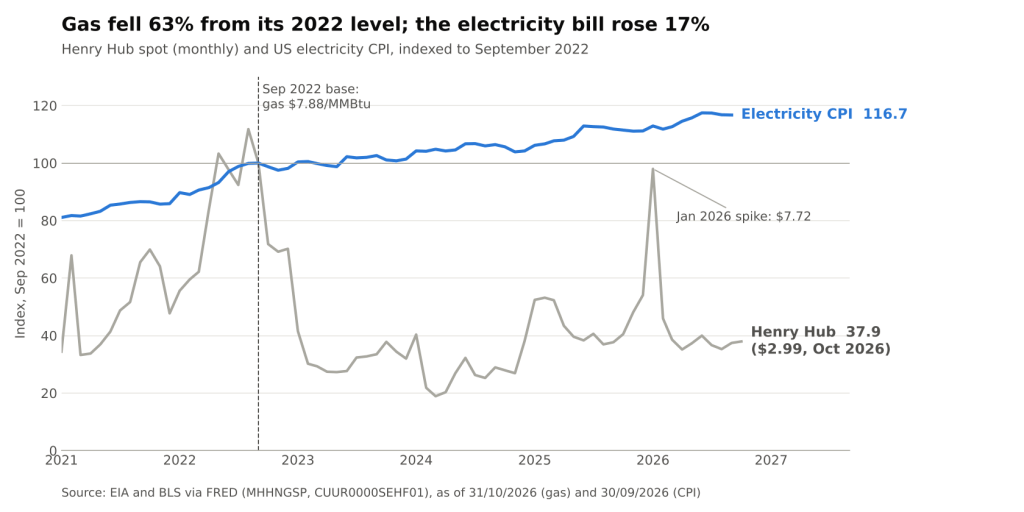
Henry Hub spot vs US electricity CPI, indexed to September 2022 (EIA and BLS via FRED @ 31/10/2026 and 30/09/2026)
Where the Bill Is Coming From
A retail bill bundles three layers: energy, capacity and delivery (wires, poles, substations). With energy cheap, the increase is coming from the other two:
- Delivery and rate base growth: investor-owned utilities requested $23.1bn of electric and gas rate increases in the first three quarters of 2026, including a record $4.5bn in Q3, according to PowerLines. Planned utility capex through 2030 has risen 21% to $1.4tn. Every dollar of that capex enters rate base and earns an allowed return, so it shows up in tariffs for decades.
- Capacity costs: in PJM, the largest US grid, capacity auctions have cleared at their regulatory ceiling. Capacity is a payment for being available at peak, and it is billed regardless of what gas costs.
- Recovery of deferred costs: storm and fuel balances deferred in earlier years are now being amortized. Jersey Central Power & Light, for example, filed for a $253m base-rate increase plus recovery of $476m in deferred storm costs spread over 10 years.
The common thread is that these costs are largely fixed and contractual. They respond to regulators and reliability planners, not to the forward gas curve, which is why cheap fuel has not translated into cheaper power.
The Capacity Market Is Pinned at Its Ceiling
PJM’s auction for the 2027/28 delivery year cleared at $333.44/MW-day across the footprint, the cap negotiated with regulators and 1.3% above the prior auction. Cleared supply times price comes to about $16.4bn. Even at that price, procured capacity fell 6,623 MW short of the reliability requirement. PJM’s own simulation without the collar put the clearing price at $529.80/MW-day, roughly 59% higher. The 2028/29 auction in July again cleared at its ceiling.
PJM attributed nearly 5,100 MW of a roughly 5,250 MW increase in its peak load forecast to data centers. That is the precise channel through which data center demand reaches household bills: not through average energy prices, but through scarcity pricing for peak capacity in a region where supply is not keeping up.
The national picture is more nuanced. An EPRI study found that, across states from 2015 to 2024, data center load growth modestly lowered average retail rates rather than raising them. Both findings can hold at once: load growth helps where generation can be added quickly, and hurts where capacity is scarce and priced at a cap.
What the Midterm Result Changes
For analysts covering regulated utilities and the credit they issue, the election shifts risk from demand to regulation:
- Regulatory lag: commissions under political pressure tend to approve less than requested or stretch decisions out. The gap between capex spent and capex earning a return widens, which weighs on earned ROE (i.e. the return actually achieved versus the allowed return).
- Cost allocation: large-load tariffs that put more of the grid cost on data centers are likely to spread. This protects households, but shifts volume and contract risk onto the utilities’ largest customers.
- Funding mix: a $1.4tn capex plan with slower recovery means more external financing. Equity issuance, asset sales and hybrid debt become more likely tools, and credit metrics such as FFO-to-debt (funds from operations over debt) come under pressure.
- Capacity market design: the cap and floor in PJM run through the 2029/30 delivery year. The political debate now shifts to what replaces them, which matters most for merchant generators whose revenue depends on auction prices.
The key distinction is between utilities with constructive regulation and fast rate-base recovery and those in states where bills became an electoral issue. The same capex plan carries very different risk depending on the commission that has to approve it.
Conclusion
US power prices have decoupled from fuel. With Henry Hub near $3, electricity inflation is now a story of wires, capacity and deferred cost recovery, all largely fixed, contractual and set by regulators. That makes the bill stickier on the way up and much less likely to fall when commodity prices do.
What to watch next: the October CPI print for whether electricity inflation stays above the headline rate, decisions on the record Q3 rate filings, the first actions of newly elected commissioners in states like Georgia, and PJM’s design for capacity pricing after the current collar expires.
Sources: BLS electricity CPI via FRED (CUUR0000SEHF01); BLS all-items CPI via FRED (CPIAUCNS); EIA Henry Hub spot price via FRED (MHHNGSP); PJM 2027/28 Base Residual Auction release; Calpine Solutions BRA report; POWER Magazine on the 2028/29 auction; Utility Dive on PowerLines Q3 2026 rate requests; EPRI data center rate study; S&P Global on the midterms; Latitude Media on the Georgia PSC.
Daniel Panizo, CFA, FMVA



Leave a Reply