
For most of the period since the Federal Reserve’s September hike, the plumbing of the US money market behaved exactly as designed. The Secured Overnight Financing Rate (SOFR, i.e. the benchmark cost of borrowing cash overnight against Treasury collateral) sat at or just below the interest rate on reserve balances (IORB), which has been 3.90% since 17/09/2026. Then, starting on 23 October, SOFR printed above IORB for 10 consecutive sessions, peaking at 3.97% on 3 November, a +7bp gap. By 9 November it had slipped back to 3.88%.
Seven basis points is not a crisis. The gap on 31/10/2025 was +32bp. What makes this episode worth studying is its timing: it arrived while the New York Fed’s Open Market Desk was in its third straight monthly period with zero reserve management purchases (RMPs, i.e. Treasury bill buying meant to keep reserves “ample”), and with weekly reserves at their lowest level of 2026. The repo market is the first place a reserve shortage shows up, and it has just sent a small but legible signal.
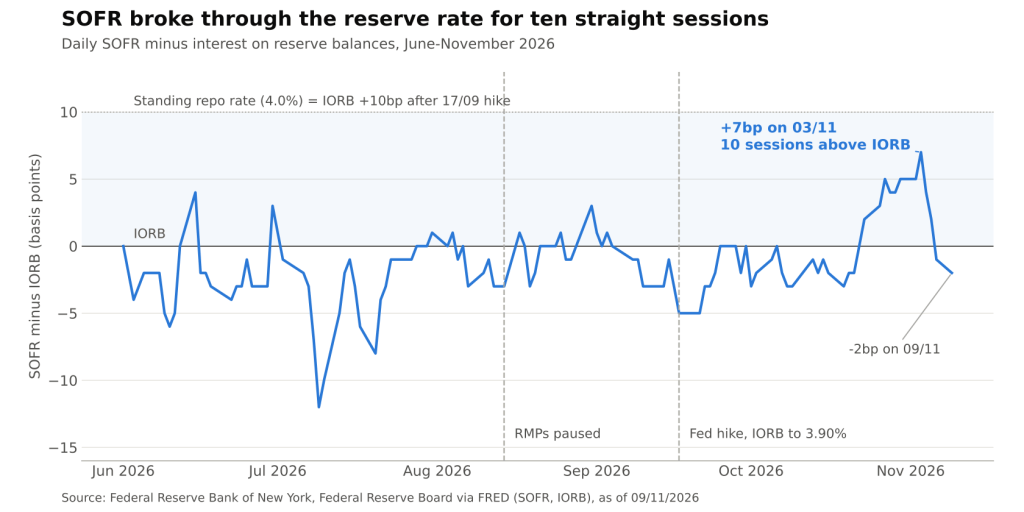
SOFR minus IORB, daily, in basis points (Federal Reserve Bank of New York and Federal Reserve Board via FRED @ 09/11/2026)
Why SOFR versus IORB is the spread that matters
In an ample-reserves regime the Fed does not target a quantity of money; it sets administered rates and lets arbitrage do the rest. Banks can earn IORB risk-free by leaving cash at the Fed, so they have little reason to lend in repo below it when they have reserves to spare. When reserves are abundant, that arbitrage keeps SOFR at or under IORB. When reserves become scarce at the margin, dealers financing large Treasury inventories must bid up for cash, and SOFR drifts above the floor.
The current corridor, set in the FOMC implementation note of 28 October, frames how far that drift can go:
- Floor: the overnight reverse repo (ON RRP) offering rate at 3.75%, the bottom of the 3.75%–4.00% target range.
- Reference: IORB at 3.90%, which SOFR should track from below while reserves are plentiful.
- Ceiling: the standing repo facility (SRF) rate at 4.0%, i.e. 10bp above IORB, where eligible dealers can borrow from the Fed against Treasuries.
The October–November streak used 70% of that 10bp headroom at its peak and averaged 4.1bp over the ten sessions. For comparison, in the 25 sessions between the hike and 22 October, SOFR never closed above IORB. The shift was abrupt, not gradual, which is typical of a market that has moved from the flat part of the reserve demand curve onto its steeper slope.
The bill buying that stopped
The supply side of reserves explains why the floor gave way now. After balance sheet runoff ended, the Desk began RMPs in December 2025 at roughly $40bn per monthly period and held that pace through mid-April 2026, for about $215bn of planned purchases across the whole program. Then it wound down quickly:
- April–May 2026: purchases cut to about $25bn.
- May–August 2026: about $10bn per period.
- Mid-August to 13 November 2026: three consecutive periods with no RMPs at all, leaving only reinvestment of agency principal into bills (about $14.6bn planned in the current period), which replaces runoff rather than adding reserves.
The pause was a reasonable judgment at the time. With SOFR at or below IORB through the summer, the Desk had little market evidence that reserves were short. The problem is that reserve demand is not static, and the liabilities that compete with reserves (the Treasury General Account, currency, and the remaining ON RRP balance) can move by tens of billions of dollars in a week around tax dates, settlements and month-ends.
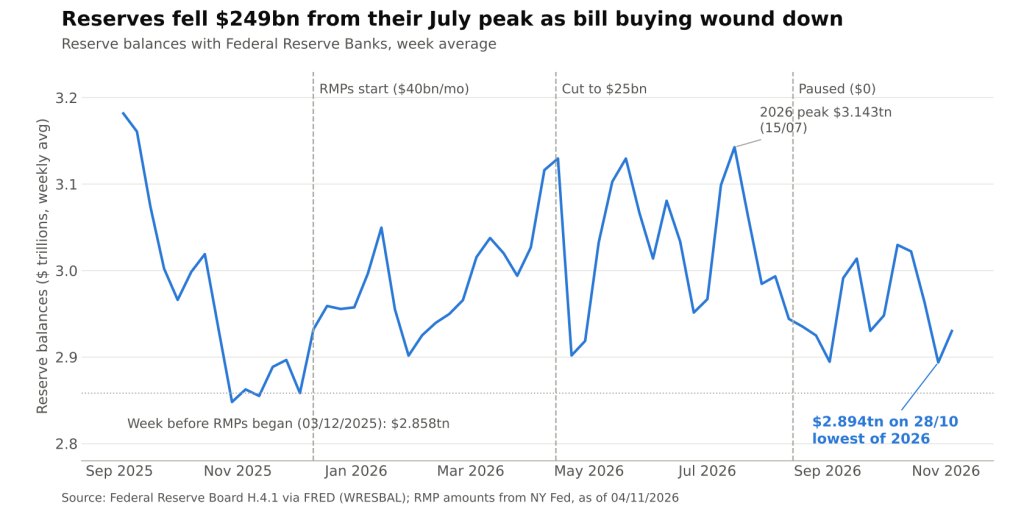
Reserve balances with Federal Reserve Banks, weekly average, $ trillions (Federal Reserve Board H.4.1 via FRED; RMP amounts from New York Fed @ 04/11/2026)
Reserves are back near where purchases began
The H.4.1 data show the effect. Weekly average reserve balances peaked at $3.143tn in the week of 15 July 2026. By the week of 28 October they had fallen to $2.894tn, a drop of $249bn and the lowest weekly reading of the year. That week overlaps the start of the SOFR streak. It also left reserves only about $35bn above the $2.858tn recorded in the week of 3 December 2025, just before RMPs started. In other words, most of the reserve cushion built by eight months of bill buying has been absorbed by shifts in other Fed liabilities.
Reserves have since bounced to $2.930tn (week of 4 November), and SOFR moved back below IORB from 6 November. That sequence is consistent with a level-driven story rather than a one-off calendar effect: the spread widened as reserves bottomed and narrowed as they recovered. Market commentary also pointed to heavy Treasury bill settlement and month-end balance sheet constraints, which tend to amplify pressure when the underlying buffer is already thin.
What the episode does and does not say
Three readings are worth separating:
- Not a 2019 repeat. The peak gap of 7bp stayed inside the SRF ceiling, and the spread normalized within two weeks without an emergency operation. The corridor did its job.
- A useful calibration point. The episode gives an empirical marker for where the steep part of the reserve demand curve begins: somewhere around $2.9tn of reserves, money market rates start to respond to small changes in supply. That is valuable information for the Desk’s monthly RMP sizing.
- A transmission issue for floating-rate borrowers. SOFR is the reference rate for a large share of US floating-rate loans, notes and derivatives. A persistent few basis points above IORB is a quiet tightening that never appears in the policy rate itself, and it lands on leveraged borrowers and basis traders first.
The policy tension is clear. The FOMC voted 10–2 to hold rates on 28 October, with two dissents in favor of a further hike. A committee leaning hawkish on rates may be reluctant to restart balance sheet growth, even when the purpose is purely technical. Yet the operating framework only works if the floor holds. Letting repo rates drift above IORB amounts to a tightening the committee did not vote for.
Conclusion
Ten sessions of SOFR above IORB, peaking at +7bp, coincided with a three-period pause in reserve management purchases and with reserves sliding $249bn from their July peak to a 2026 low. The signal is modest and has already faded, but it suggests the system is now operating close to the edge of “ample,” with little buffer left over the level at which bill buying began.
The next data points will settle whether this was a calibration wobble or the start of a pattern: the Desk’s monthly schedule for the period beginning mid-November (any non-zero RMP amount would be a direct response), SOFR behavior around the November and December month-ends, SRF take-up, and the weekly H.4.1 reserve figure relative to the $2.9tn zone.
Sources: FRED – SOFR; FRED – IORB; FRED – Reserve Balances (WRESBAL); Federal Reserve – Implementation Note, 28 October 2026; New York Fed – Treasury Securities Operational Details.
Daniel Panizo, CFA, FMVA


Leave a Reply