
For most of 2026, U.S. crude has traded at prices that, in any previous cycle, would have set off a drilling scramble. West Texas Intermediate (WTI) averaged $102.07 a barrel in October, up 58% from $64.51 in February, before the Middle East conflict pushed prices higher (EIA monthly averages via FRED). Even after the recent slide on peace-deal hopes, the daily WTI spot price was still $99.64 on 3 November.
The industry response has been unusually muted. The Federal Reserve’s index of output from drilling oil and gas wells (i.e. the real activity of drilling contractors, not oil production) rose only 3.4% between February and September 2026. ConocoPhillips’ third-quarter results, released on 5 November, show where the money went: a $1.8bn jump in quarterly operating cash flow, of which only a small slice went back into the ground. That split matters for oil services revenue, for future U.S. supply and for anyone trying to work out how long this price spike can last.
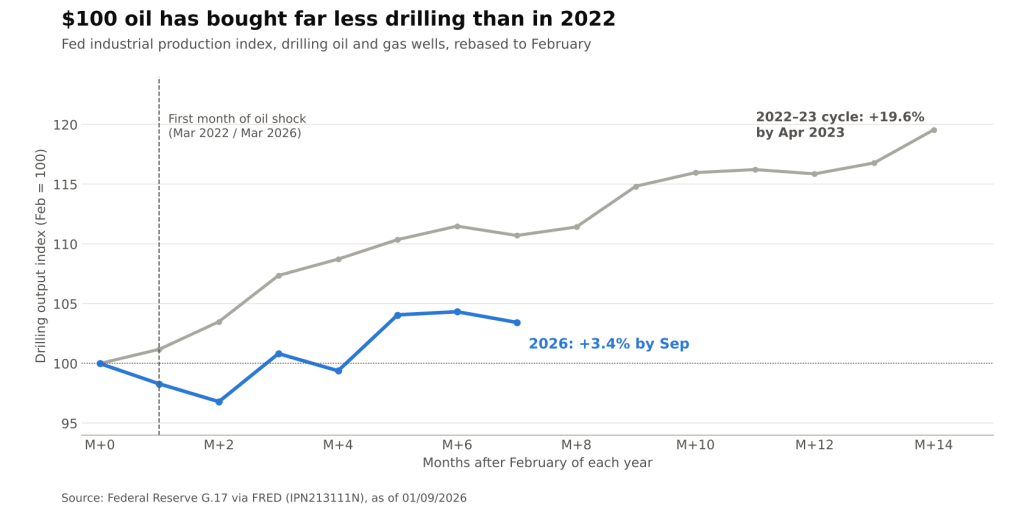
Fed industrial production index for drilling oil and gas wells, rebased to February of each year (Federal Reserve G.17 via FRED, IPN213111N @ 01/09/2026)
A Much Weaker Response Than in 2022
The 2022 energy shock is the obvious benchmark. From February to September 2022 the drilling index rose 10.7%, and it kept climbing to a total gain of 19.6% by April 2023. Over the same seven months of 2026 it has risen roughly a third as much. In the first two months of this year’s shock the index actually fell: it was below its February level in March and April 2026, even as WTI went from the mid-$60s to above $100.
Prices alone do not explain the gap. WTI averaged $102.03 from March to September 2022 and $91.47 over the same months of 2026, which is lower but still far above most shale breakevens. Three structural differences carry more weight:
- The shock looks temporary. The 2026 rally comes from supply disruption around the Strait of Hormuz rather than from demand. With crude falling sharply on Iran peace headlines in recent weeks, management teams have little reason to commit to wells that pay back over several years.
- Starting from a lower base. In 2022 the industry was coming out of the pandemic trough and rehiring rigs and crews it had idled. In 2026 activity began from a flat, consolidated base after several years of mergers, so there was no backlog of deferred activity to restart.
- Investors set the rules. Since the 2014–2016 bust, public producers have tied pay and guidance to returns on capital and to payout ratios, not to volume growth. A higher oil price now feeds the distribution formula first.
Following the Cash at ConocoPhillips
ConocoPhillips, a bellwether for large U.S. exploration and production companies, shows that playbook clearly. Its total average realized price rose 32% year on year to $61.40 per barrel of oil equivalent (BOE). The figure sits well below headline crude because the BOE mix includes natural gas and natural gas liquids, and because WTI averaged a more modest $87.22 across the third quarter.
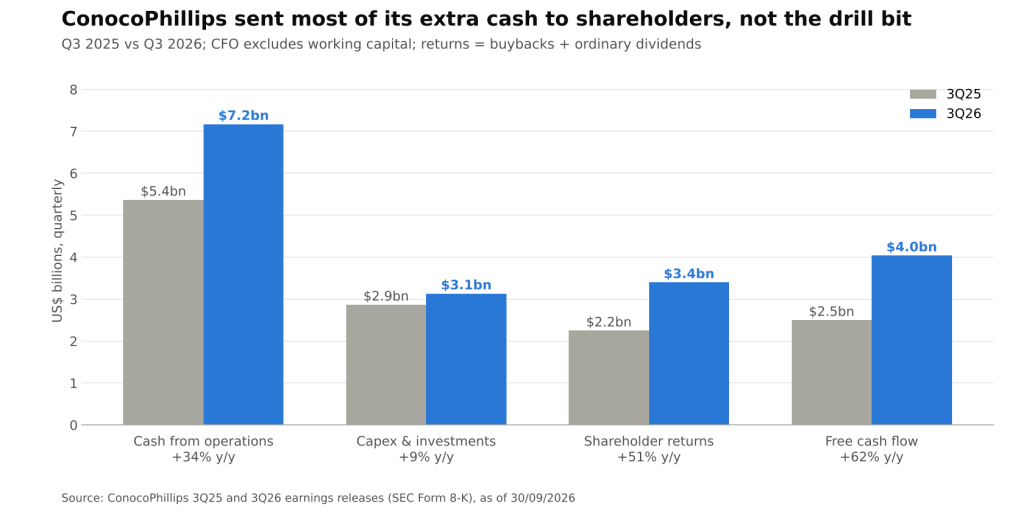
ConocoPhillips cash from operations, capex, shareholder returns and free cash flow, Q3 2025 vs Q3 2026 (ConocoPhillips earnings releases, SEC Form 8-K @ 30/09/2026)
Cash from operations (CFO, which excludes working-capital swings) rose from $5.37bn to $7.17bn, an increase of 34%. The incremental $1.81bn was split as follows:
- Capital expenditures and investments: up $0.27bn to $3.13bn (+9%), absorbing about 15% of the extra cash.
- Shareholder distributions: buybacks of $2.4bn and ordinary dividends of $1.0bn took the total to $3.4bn, up about $1.15bn (+51%), or roughly 64% of the incremental cash. Buybacks nearly doubled from $1.27bn.
- Balance sheet: the rest, together with $1.6bn of disposition proceeds, went largely to liquidity, with cash and short-term investments ending the quarter at $10.4bn.
The result is a falling reinvestment rate (i.e. capex as a share of CFO), from 53% in Q3 2025 to 44% in Q3 2026. Over the same period the share of CFO returned to shareholders rose from 42% to 47%, in line with the company’s 45% full-year target. Free cash flow climbed 62% to $4.04bn. Management also raised the quarterly dividend 11% to $0.93 and left full-year capex guidance unchanged. That guidance was set at about $12bn in November 2025, when WTI was near $60.
Volumes tell the same story. Total production was 2,302 thousand BOE per day, down 2% on an underlying basis, partly because of disruption to its Qatar operations. Lower 48 output, the shale engine, was 1,517 thousand BOE per day against 1,528 a year earlier. A 32% higher realized price produced essentially no extra onshore growth.
Why the Capital Allocation Choice Matters
A producer that holds its budget fixed through a price spike turns the commodity move almost entirely into free cash flow. For analysts this has several consequences:
- Earnings quality versus durability. Higher free cash flow funded by a fixed budget is high-quality cash, but it lasts only as long as the price. With no volume growth behind it, the cash generation would fade quickly if crude fell back.
- Oil services lag producers. Contractors are paid per rig, crew and well. A drilling index up only low single digits means the 2026 price spike has done little for U.S. land service revenue. The gap between upstream and services margins in this cycle comes straight from the allocation choice above.
- A weaker supply response caps less of the upside. Shale has acted as the world’s short-cycle swing supply. If price spikes no longer bring forth new wells within a few quarters, that buffer is thinner. In future disruptions, prices may have to rise further, or demand fall further, to rebalance the market.
- Valuation frameworks shift. When most incremental cash is paid out, a producer’s equity behaves more like a high-payout yield instrument tied to the oil price than a growth asset. That changes which multiples (free cash flow yield rather than reserve growth) carry the analysis.
One company is not the whole industry. Private operators, which do not answer to public shareholders on payout ratios, are often quicker to add rigs, and the drilling index aggregates both groups. Even so, the combination of a near-flat activity index and a large producer sending close to two-thirds of its windfall to shareholders points in a single direction.
Conclusion
The 2026 oil shock has tested capital discipline under the most tempting conditions, and so far discipline has held. Drilling output rose 3.4% against 10.7% over the comparable stretch of 2022, and ConocoPhillips put about 15% of its extra operating cash into capex and about 64% into buybacks and dividends. The windfall is going to owners, not to new supply.
The things to watch next are the October and November readings of the Fed drilling index, 2027 capex guidance from the large producers early next year, and whether the recent fall in crude on peace-deal headlines pushes buyback pacing down before budgets move at all. If budgets stay flat even after a full year of high prices, the U.S. supply response will have to be treated as structurally slower than in past cycles.
Sources: Federal Reserve, Industrial Production: Drilling Oil and Gas Wells (FRED IPN213111N); EIA, WTI monthly spot price (FRED MCOILWTICO); EIA, WTI daily spot price (FRED DCOILWTICO); ConocoPhillips third-quarter 2026 results (SEC Form 8-K); ConocoPhillips third-quarter 2025 results and supplemental data (SEC Form 8-K).
Daniel Panizo, CFA, FMVA


Leave a Reply