
The October CPI report, released on 10 November, did what a hot inflation print usually does to the front of the Treasury curve. Headline CPI rose 0.4% on the month and core rose 0.3% for a third straight month, and the 5-year Treasury yield climbed from 4.67% on 9 November to 4.95% on 12 November. In isolation, a 28bp rate move in three sessions should have pushed every fixed-rate borrowing cost higher.
US high yield did not follow. Over the same window the ICE BofA US High Yield Index option-adjusted spread (OAS, i.e. the extra yield over Treasuries after adjusting for embedded call options) tightened from 3.34% to 3.20%, and the index effective yield rose only 16bp, to 8.16%. Measured from the 5 November spread peak, the contrast is starker: Treasuries up 36bp, spread down 28bp, all-in yield up just 9bp. The spread acted as a shock absorber, and why it could do so this time but not in September says a lot about where the credit market stands.
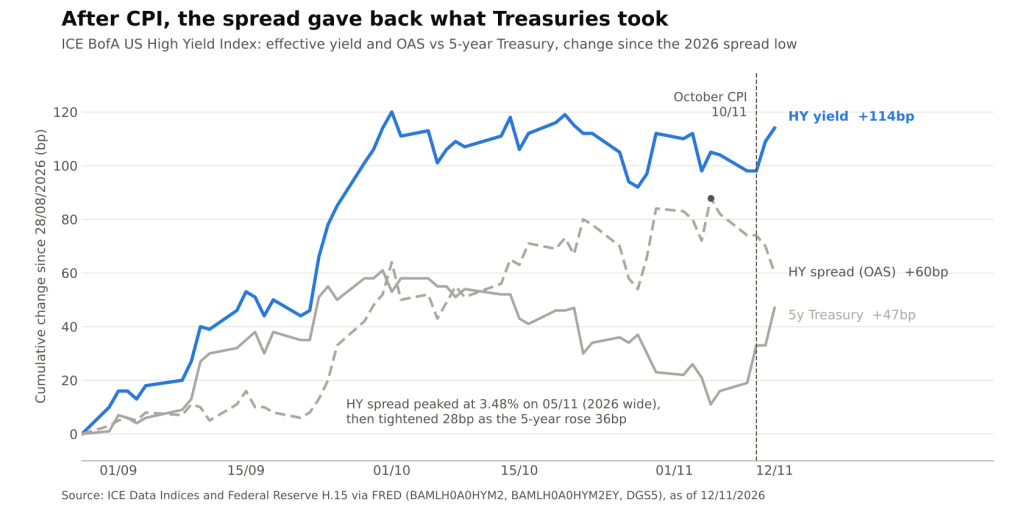
Cumulative change in the ICE BofA US HY effective yield, HY OAS and 5-year Treasury yield since the 2026 spread low (ICE Data Indices and Federal Reserve via FRED @ 12/11/2026)
Two Legs of One Yield
A high-yield bond’s yield can be split into a risk-free leg and a credit leg. The risk-free leg moves with Treasuries, i.e. with inflation and Fed expectations. The credit leg, the spread, moves with default risk, risk appetite and supply. The total yield is what issuers actually pay and what income-focused buyers actually lock in.
The two legs are not independent. When rates rise because growth is strong, spreads often compress at the same time: stronger growth lowers expected defaults, and higher all-in yields pull in buyers who target a yield level rather than a spread. When rates rise because of a growth or financial shock, both legs can widen together. Which relationship dominates decides whether a Treasury selloff passes through to junk borrowers in full or gets partly cancelled out.
Three Episodes, Three Different Responses
The autumn offers a useful natural experiment, because the market has gone through all three combinations in ten weeks.
- Pure rates selloff (1–23 September). The 5-year rose from 4.55% to 4.99%, a 44bp move. The spread barely reacted, edging from 2.65% to 2.73%, so the HY yield rose 50bp, slightly more than Treasuries. There was no offset at all.
- Credit shock (23 September–1 October). Treasuries were almost flat (+2bp), but the spread jumped 51bp to 3.24%. The HY yield rose 54bp and hit its 2026 high of 8.22% on 1 October.
- Post-CPI rates selloff (5–12 November). The 5-year rose 36bp, from 4.59% to 4.95%, while the spread fell 28bp, from 3.48% to 3.20%. The HY yield rose only 9bp.
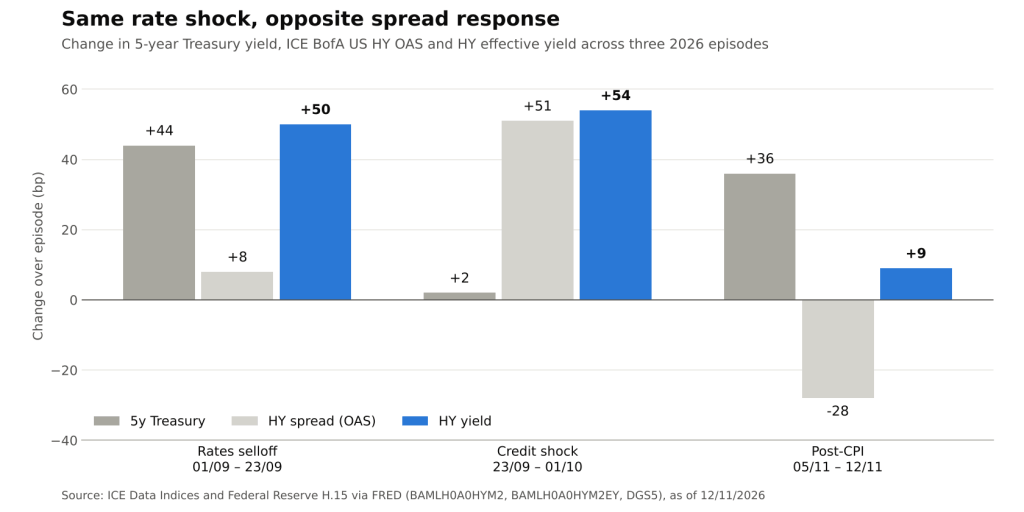
Change in the 5-year Treasury yield, ICE BofA US HY OAS and HY effective yield across three 2026 episodes (ICE Data Indices and Federal Reserve via FRED @ 12/11/2026)
The September and November rate moves were similar in size, yet one passed through to junk yields almost one-for-one and the other was largely absorbed. The difference was not the rate shock itself. It was the starting level of the spread.
Why the Cushion Existed in November
On 28 August the HY OAS hit its 2026 low of 2.60%. With spreads that compressed, there was very little credit premium left to give back, so when Treasuries sold off in September the full move reached borrowers. The spread was already near the floor and could not act as a buffer.
By early November the picture had changed. The late-September credit shock and a choppy October left the OAS at 3.48% on 5 November, the widest reading of 2026 to date. The spread share of the all-in yield (OAS divided by effective yield) had risen to 43.1%, against 35.5% on 23 September. That gave the market room to reprice the credit leg tighter when the rate leg moved higher, and it did: by 12 November the share was back to 39.2%.
Several mechanics plausibly reinforced the offset:
- Yield-targeting demand. With the index effective yield back above 8%, buyers focused on income levels rather than spread levels have a reason to add exposure on rate-driven cheapening, which compresses spreads.
- A growth signal inside the inflation signal. A firm core print can also be read as evidence of solid nominal demand, i.e. lower near-term default risk, which supports credit even as it hurts duration.
- Mean reversion after a credit-specific scare. To the extent the October widening reflected a stress premium rather than a change in fundamentals, some of the tightening is that premium unwinding rather than a fresh vote of confidence.
What It Means for Borrowers and Portfolios
- Borrowing costs are set by the sum, not the spread. Despite the tightening, the HY effective yield on 12 November, at 8.16%, sat just 6bp below its 2026 high and 173bp above its 2026 low of 6.43% (19 January). For issuers refinancing coupons struck in a lower-rate era, the November offset limited the damage but did not reverse it.
- The buffer is finite. Since the spread low on 28 August, the OAS is still up 60bp and the 5-year 47bp, for a 114bp rise in the HY yield. Each further rate-driven tightening leaves less spread to absorb the next move, returning the market to its September configuration.
- Correlation is regime-dependent. Hedging or relative-value frameworks that assume a stable rates-spread correlation broke down across these three episodes. The sign flipped within weeks, depending on the starting spread level and on whether the shock was rates-led or credit-led.
One caveat on the inflation side: because the Bureau of Labor Statistics did not collect October 2025 prices during last year’s funding lapse, the October 2026 release carries no 12-month changes for most indexes. Markets are reading the monthly prints, which raises the weight each release carries.
Conclusion
The post-CPI week showed high yield’s spread doing its job as a buffer: Treasuries sold off 36bp from 5 November, yet junk yields rose only 9bp because the credit premium compressed 28bp. That cushion existed only because October had rebuilt it. At the August tights, the same rate shock passed straight through.
The next test is the November CPI release on 10 December. With the OAS back at 3.20% and the spread share of yield down to 39.2%, the key question is whether another hot print meets a spread that still has room to tighten, or one already back near the levels where it offered no protection in September.
Sources: ICE BofA US High Yield Index OAS (FRED); ICE BofA US High Yield Index Effective Yield (FRED); 5-Year Treasury Constant Maturity (FRED); BLS, Consumer Price Index – October 2026.
Daniel Panizo, CFA, FMVA



Leave a Reply