
The Federal Reserve’s balance sheet is growing again, but not evenly. The H.4.1 release of 12/11/2026 shows Treasury holdings at $4.587tn as of 11/11/2026, up about $398bn from their 03/12/2025 trough. Over roughly the same window, holdings of agency mortgage-backed securities (MBS) fell by about $170bn to $1.884tn. The Fed is once again a net buyer of government debt, yet it remains a steady net seller, through runoff, of mortgage risk.
That asymmetry matters now because the bond market has just been tested. A hot October CPI report (+0.4% headline, +0.3% core month on month) pushed the 10-year Treasury yield to 5.10% on 12/11/2026, and Freddie Mac’s 30-year fixed mortgage rate sits at 7.11%. The more useful number is the gap between the two: during this autumn’s selloff, the mortgage spread to the 10-year widened by about 55bp. That is what a mortgage market without a central-bank backstop looks like under pressure.
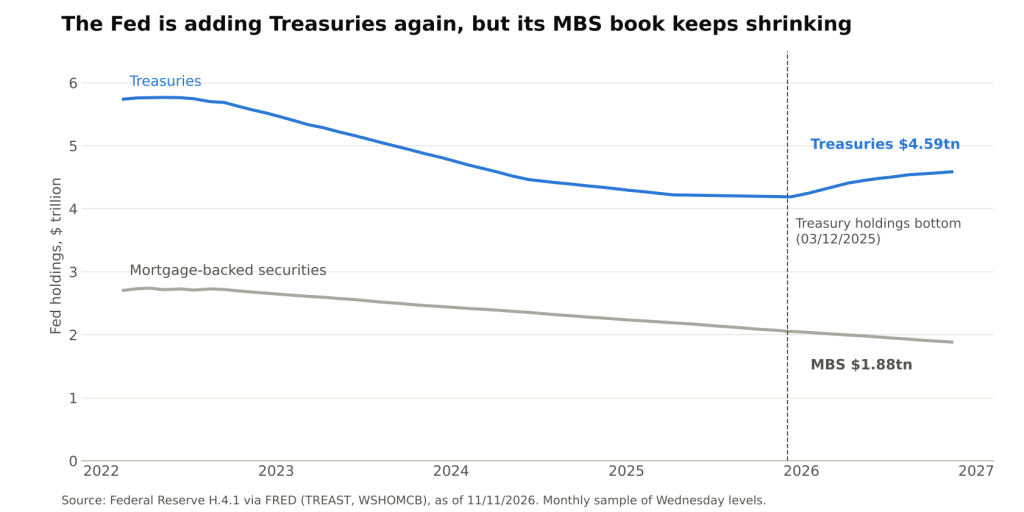
Fed holdings of Treasuries and MBS, monthly sample of Wednesday levels, $ trillion (Federal Reserve H.4.1 via FRED, TREAST and WSHOMCB @ 11/11/2026)
Two Portfolios Moving in Opposite Directions
Between 2022 and late 2025, quantitative tightening shrank both books at once. Since December 2025 the paths have split. The Treasury portfolio has climbed back to its highest level in this sample since early 2024, while the MBS book has kept shrinking at an average of roughly $15bn a month. From its 2022 level of about $2.74tn, the Fed’s MBS holdings are now down by roughly $857bn.
The mix has shifted accordingly. MBS made up about 32.9% of the Fed’s combined Treasury and MBS holdings in December 2025 and about 29.1% as of 11/11/2026. Whatever the exact split between reinvestment and reserve-management purchases, the direction is clear: new Fed demand is going into government paper, not mortgages.
This is a deliberate long-run preference, not an accident. The FOMC’s stated long-run aim is a portfolio held primarily in Treasuries, so the MBS book will keep running off as homeowners pay down and refinance their loans. Runoff is also slow by construction: with mortgage rates above 7%, few borrowers have a reason to refinance, so prepayments trickle in and the MBS book shrinks gradually rather than all at once.
What the Mortgage Spread Measures
The spread between the 30-year mortgage rate and the 10-year Treasury yield is not a pure credit spread, since agency MBS carry a government-sponsored guarantee. It bundles three things:
- Primary-secondary margin, i.e. what lenders and servicers keep between the borrower’s rate and the yield on the MBS they sell.
- Option cost: borrowers can prepay at par, so MBS investors are short a call option. The value of that option rises with interest-rate volatility.
- Balance-sheet cost, i.e. the compensation private holders (banks, money managers, hedge funds) demand to warehouse duration and convexity risk without the Fed as a price-insensitive buyer.
The Fed’s Treasury purchases work directly on the Treasury curve. They do nothing for the second and third parts. When rate volatility rises, the mortgage spread has to clear with private balance sheets alone.
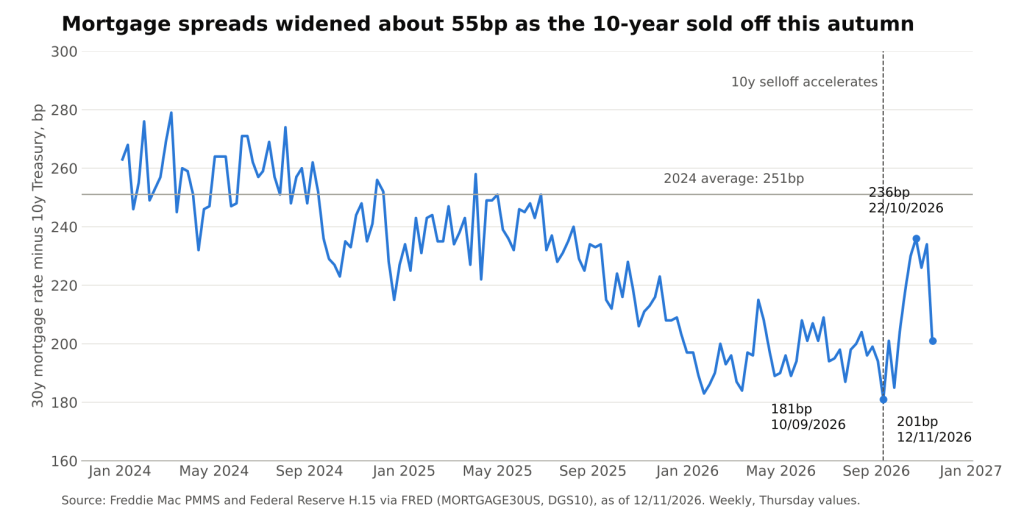
30-year fixed mortgage rate minus 10-year Treasury yield, weekly Thursday values, basis points (Freddie Mac PMMS and Federal Reserve H.15 via FRED, MORTGAGE30US and DGS10 @ 12/11/2026)
The Autumn Stress Test
Measured on Thursday values, the spread had compressed steadily: from an average of 251bp in 2024 to 230bp in 2025 and about 200bp so far in 2026. It hit 181bp on 10/09/2026, its lowest weekly reading since at least the start of 2024. Then the 10-year sold off, and the spread jumped to 236bp by 22/10/2026.
From 03/09/2026 to 12/11/2026 the 10-year yield rose 33bp while the mortgage rate rose 40bp. Mortgage rates did not just follow Treasuries higher; they overshot. Three mechanics explain the move:
- Extension risk: as rates rise, expected prepayments slow and MBS duration lengthens, so holders must sell duration or hedge into a falling market. That selling pushes mortgage yields up faster than Treasury yields.
- Volatility repricing: higher realized rate volatility raises the value of the borrower’s prepayment option, so investors demand more spread to hold it.
- No marginal buyer: in 2020–2021, Fed purchases absorbed this kind of pressure. In 2026 the Fed is shrinking the same asset class, so private demand has to absorb the extension supply on its own.
A caveat on the latest reading. The 12/11/2026 spread of 201bp is flattered by timing: Freddie Mac’s weekly survey reflects mortgage applications submitted earlier in the week, while the 10-year jumped on the day of the comparison. The prior week’s reading was 234bp, and the four-week average is about 224bp. The spread has not snapped back to its September low.
Why the Year-on-Year Picture Still Looks Benign
Over twelve months, the 10-year yield is up 99bp (from 4.11% to 5.10%) while the mortgage rate is up 87bp (from 6.24% to 7.11%), so the spread is about 12bp tighter than a year ago. That reflects the long compression of 2025 and early 2026, when lower volatility and patient private buyers narrowed the gap even as Fed runoff continued.
The lesson is about sensitivity, not the level. The spread can tighten in calm markets without Fed support, but when volatility arrives the adjustment is quick and lands on borrowers. For housing, this means the pass-through from Treasury yields to mortgage rates is no longer one-for-one in a selloff; it can run above one. For MBS investors, the spread now pays largely for carrying convexity risk that the Fed no longer shares.
Implications
- Policy transmission: Fed Treasury purchases ease conditions in the government market, but mortgage spreads remain exposed to rate volatility. Any tightening in December would hit mortgage rates through both the Treasury yield and the spread.
- Housing affordability: with the 30-year rate above 7%, a spread near its four-week average of about 224bp rather than September’s 181bp adds roughly 43bp to new loans, independent of where Treasuries trade.
- Relative value: the mortgage-Treasury spread is wide versus its 2026 low but still below its 2024 average. Its path depends more on rate volatility than on the level of yields.
Conclusion
The Fed’s balance sheet has turned, but only for Treasuries. With MBS holdings at $1.884tn and still falling, the mortgage market carries its own volatility risk, and this autumn’s 55bp spread widening showed what that costs when Treasuries sell off.
Next to watch: whether rate volatility fades after the December FOMC, the weekly Freddie Mac readings for a sustained move back toward the 2026 average of about 200bp, and any sign in Fed communication that reinvestment or purchase policy might reach beyond Treasuries.
Sources: Federal Reserve H.4.1 (12/11/2026); FRED: TREAST, WSHOMCB, MORTGAGE30US (Freddie Mac PMMS), DGS10; CNBC markets coverage, 13/11/2026.
Daniel Panizo, CFA, FMVA



Leave a Reply