
Corporate treasurers spent much of 2026 hearing that credit markets were wide open. The data supports that: the spread on Moody’s seasoned Baa corporate bonds over the 10-year Treasury, i.e. the extra yield investors demand for lending to the lowest tier of investment grade, sat at 148bp on 12 November 2026, down from 175bp a year earlier. Yet the all-in cost of that debt is materially higher. The Baa yield closed at 6.58% on 12 November, up 75bp from 5.83% twelve months before.
The October CPI report on 10 November, which showed headline prices up 0.4% on the month after 0.6% in September, pushed that number higher again. Between 9 and 12 November the 10-year Treasury yield rose from 4.88% to 5.10% and the Baa yield from 6.39% to 6.58%. For anyone running a discounted cash flow model or a capital allocation committee, the useful question is not whether credit is “tight” or “wide” but which component of the cost of debt is moving, and what that implies for hurdle rates.
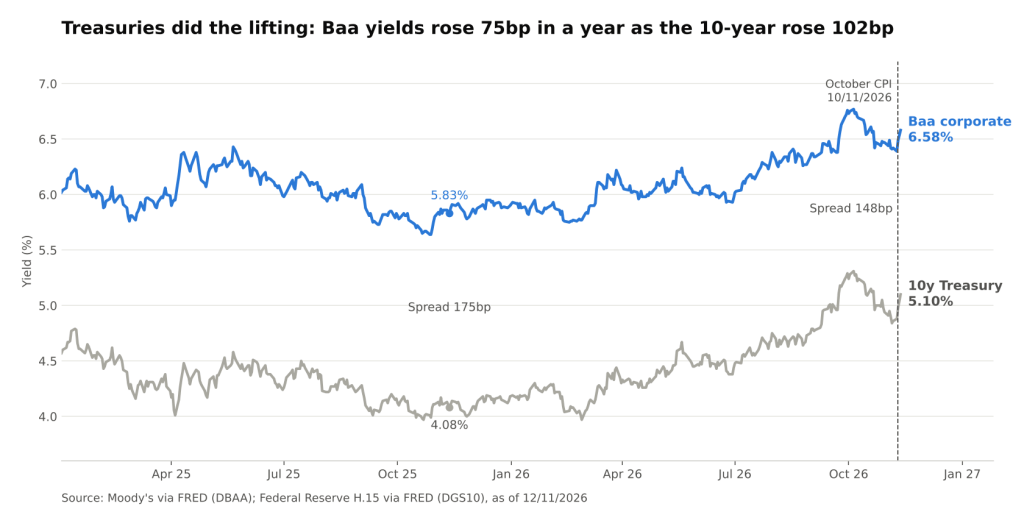
Moody’s Baa corporate yield vs 10-year Treasury yield, January 2025 to November 2026 (Moody’s and Federal Reserve via FRED @ 12/11/2026)
Two components, moving in opposite directions
A corporate bond yield can be split into a risk-free base (here the 10-year Treasury) and a credit spread. Over the twelve months to 12 November 2026 the two moved in opposite directions:
- Risk-free base: the 10-year Treasury rose 102bp, from 4.08% to 5.10%, and touched 5.31% on 5 October, its highest close since the start of 2025.
- Credit spread: the Baa-Treasury gap narrowed 27bp, from 175bp to 148bp, after reaching 139bp on 23 September, the tightest level since January 2025. That compares with a 2025 average of roughly 171bp and a peak of 202bp during the April 2025 tariff shock.
- Net effect: spread compression offset only about a quarter of the rise in Treasuries, leaving the Baa yield 75bp higher. Treasuries now account for 77.5% of the Baa yield.
This matters because the two components carry different information. A widening spread tells a CFO that lenders are worried about corporate credit risk. A rising base rate tells them the price of time has gone up for everyone, regardless of balance sheet quality. The 2026 increase in borrowing costs belongs almost entirely to the second category: an inflation and policy-rate story, not a credit story.
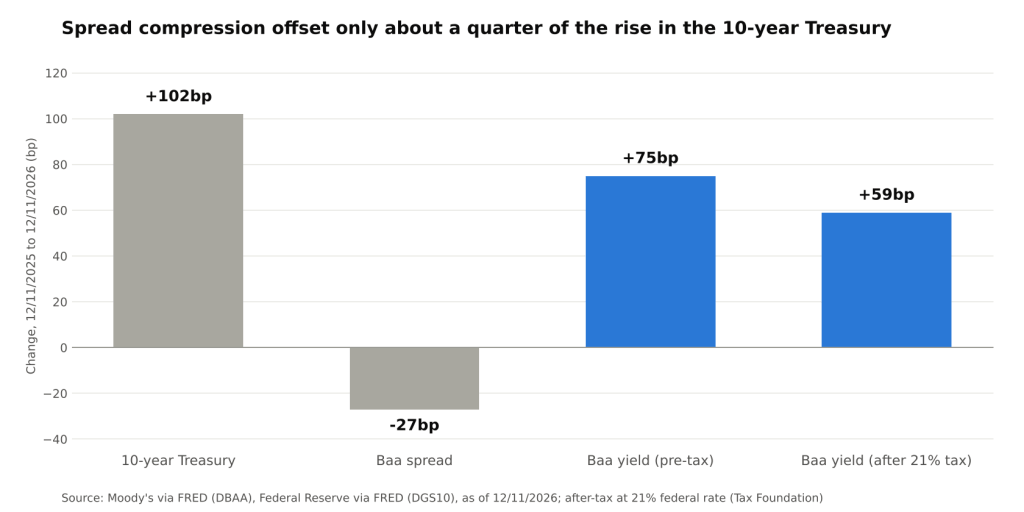
Change in the components of Baa borrowing cost, 12/11/2025 to 12/11/2026, after-tax at the 21% federal rate (Moody’s and Federal Reserve via FRED, Tax Foundation @ 12/11/2026)
From yield to after-tax cost of debt
In a weighted average cost of capital (WACC) calculation, the relevant figure is the after-tax cost of debt, because interest is deductible. Applying the 21% federal corporate rate, and ignoring state taxes and deduction limits for simplicity, a Baa-type issuer’s marginal after-tax cost of 10-year-ish debt moved as follows:
- November 2025: 5.83% x (1 – 0.21) = 4.61%.
- November 2026: 6.58% x (1 – 0.21) = 5.20%.
- Change: +59bp after tax, versus +75bp pre-tax. The tax shield absorbs part of the increase, but only in proportion to the rate.
In cash terms, refinancing $1bn of maturing debt at today’s Baa yield instead of last November’s costs about $7.5m more a year in interest before tax, or roughly $5.9m after tax. Measured from the October 2025 low of 5.64%, the pre-tax increase is 94bp. For a mid-sized BBB issuer with several billion of bonds rolling over the next few years, that is a recurring drag on free cash flow, not a rounding error.
Why the source of the move changes the WACC math
The decomposition is not just an accounting nicety. Because the risk-free rate also sits inside the cost of equity under CAPM, i.e. the risk-free rate plus beta times the equity risk premium, a Treasury-driven rise in borrowing costs feeds through both sides of the capital structure. A spread-driven rise, by contrast, mostly hits debt. Three implications follow:
- Hurdle rates move more than the bond market headline suggests. If the equity risk premium is held constant, the cost of equity rises roughly one-for-one with the 102bp Treasury move, while the cost of debt rises only 75bp pre-tax. A blended WACC therefore moves closer to the Treasury change than to the Baa change.
- Leverage does not lower WACC as much as it used to. Substituting debt for equity cuts WACC because after-tax debt is cheaper than equity. That gap has not widened this year, since both legs rose, so the case for debt-funded buybacks rests on the same spread between the two costs, now at a higher absolute level of interest expense and coverage risk.
- Tight spreads are a thin cushion. With the Baa spread near the bottom of its post-2025 range, there is little room for further compression to offset another leg higher in Treasuries. If spreads mean-revert toward the 2025 average while rates hold, the cost of debt would rise again even without a change in the base rate.
What could change the picture
The near-term driver remains the Fed. Governor Waller said on 10 November that he backed a quarter-point hike in December, according to market commentary, and the October CPI data did little to soften that stance. Two scenarios frame the range for corporate funding costs:
- Rates stabilize, spreads hold: the cost of debt plateaus near current levels. Issuers that delayed refinancing would face today’s 6.5%-area coupons rather than a further step up, and valuation discount rates would stop drifting higher.
- Rates rise further, spreads widen: the two components stop offsetting and start compounding. This is the combination that historically tightens financing conditions fastest, because it raises both the price of money and the price of risk at once.
A third path, in which spreads tighten further while Treasuries rise, looks less likely from here simply because the spread is already close to its tightest level of the period. Spread compression has done most of the work it can do.
Conclusion
The narrowing in investment-grade spreads has masked a real increase in corporate borrowing costs. Over the past year, the Baa yield rose 75bp and the after-tax cost of debt 59bp, almost entirely because the 10-year Treasury rose 102bp. Because the same base rate drives the cost of equity, the effect on WACC and hurdle rates is broader than the bond market headline implies.
The points to watch are the December FOMC decision, the November CPI release on 10 December, and whether the Baa spread holds near 150bp or starts to drift back toward its 2025 average. A widening spread on top of today’s Treasury yields would turn a rate story into a credit story.
Sources: Moody’s Seasoned Baa Corporate Bond Yield (FRED, DBAA); 10-Year Treasury Constant Maturity (FRED, DGS10); BLS Consumer Price Index, October 2026; Tax Foundation, 2026 corporate tax rates; Saxo Market Quick Take, 11 November 2026.
Daniel Panizo, CFA, FMVA



Leave a Reply