
The Federal Reserve’s October 2026 Senior Loan Officer Opinion Survey (SLOOS), published on 2 November, carried a reading that cuts against the rest of the bank data. The net share of domestic banks reporting stronger demand for commercial and industrial (C&I) loans from large and middle-market firms fell to -11.7%, from +16.1% in the July survey: a 27.8-point swing and the first negative print since July 2025. Yet over the same period, C&I balances on bank books kept rising, and loans from banks to nondepository financial institutions (NDFIs, i.e. private credit funds, finance companies, private equity vehicles and similar) climbed to a record $2.11 trillion.
The two observations are consistent once the plumbing is traced. Corporate borrowers are not walking away from credit; part of their demand is being routed through nonbank lenders, which then fund themselves at the same banks. For credit analysts this matters more than the headline demand figure, because it changes where the credit risk sits and who sees it first.
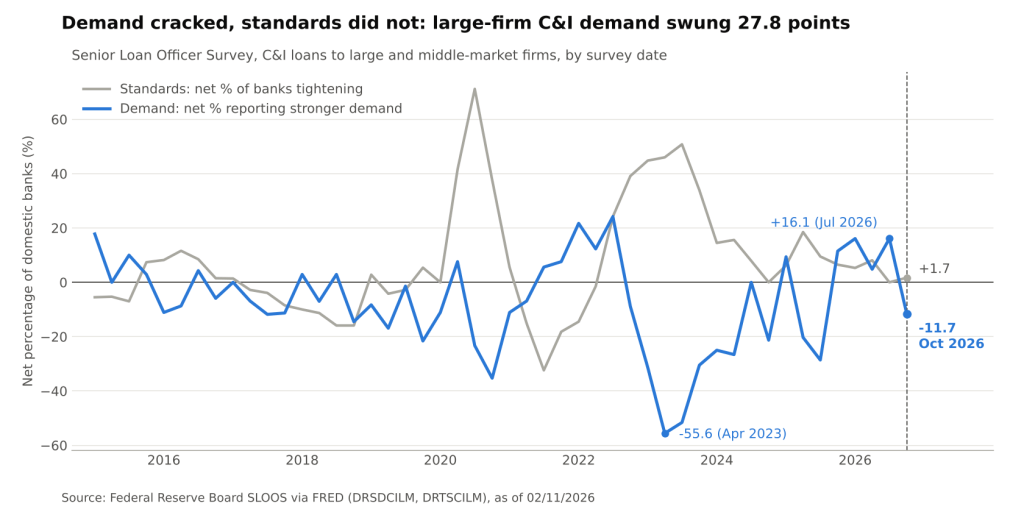
Net share of banks reporting stronger C&I loan demand vs net share tightening standards, large and middle-market firms (Federal Reserve SLOOS via FRED @ 02/11/2026)
Demand fell without a credit squeeze
The decline in demand did not come from banks pulling back. Net tightening of C&I standards for large and middle-market firms was just +1.7%, which the Fed classifies as basically unchanged, compared with a peak of +50.8% in the July 2023 survey. Standards for small firms tightened modestly, at +5.1%, while small-firm demand also turned negative at -11.9%, down from +3.6% in July. The Fed noted that banks eased or left unchanged most loan terms, with tighter premiums on riskier loans as the main exception.
That pattern, weaker demand with unchanged supply, is unusual. In 2023 the demand index troughed at -55.6%, but banks were tightening aggressively at the same time and higher rates were choking investment. This time, the survey points to two specific causes. Banks cited as important reasons for weaker demand:
- Lower capex: decreasing customer investment in plant or equipment, a cyclical signal that fits a hiking cycle.
- Substitution: customer borrowing shifting to more attractive bank or nonbank funding sources, a structural signal about market share rather than appetite for debt.
The second reason is the more durable one. It says the borrower still wants the money but finds better terms elsewhere, whether on structure, speed or covenant flexibility as much as on headline price.
Where the money went: banks lending to the lenders
The same survey’s special questions on NDFI lending show where that demand resurfaced. Banks reported stronger demand for loans from business credit intermediaries and from private equity funds, while demand from mortgage, consumer and other NDFIs was unchanged. The most cited reasons were higher working capital or liquidity needs, better investment opportunities for the NDFIs, and refinancing needs.
The H.8 balance-sheet data confirm the flow. Bank loans to NDFIs reached $2,112.8bn in October 2026 (seasonally adjusted), up 20.1% year on year, or $353.1bn. C&I loans rose to $2,992.9bn, up 11.2%, or $300.6bn. In dollar terms, lending to the lenders grew faster than direct lending to companies. The NDFI book is now 70.6% the size of the C&I book, from 65.4% a year earlier; the weekly data for 4 November put the ratio at 70.8%.
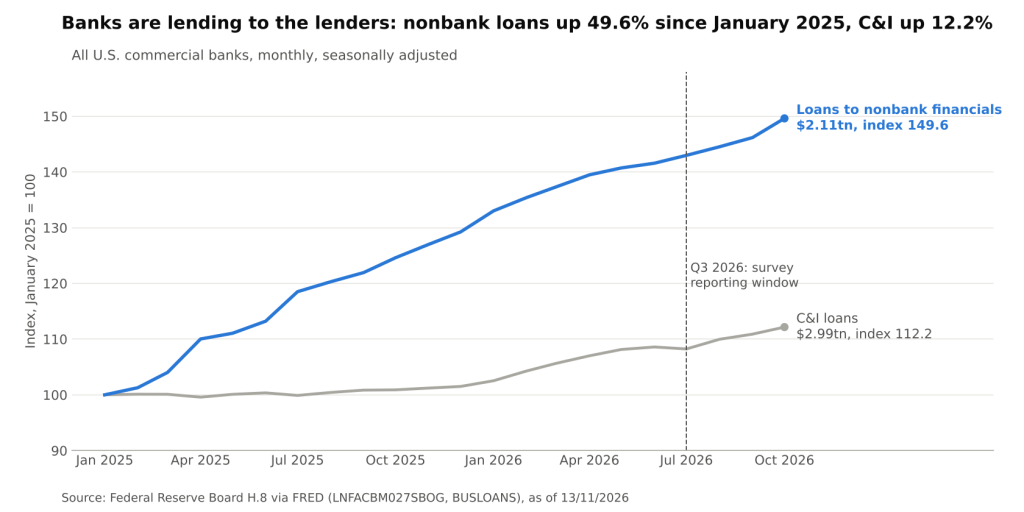
Bank loans to nondepository financial institutions vs C&I loans, all commercial banks, index January 2025 = 100 (Federal Reserve H.8 via FRED @ 13/11/2026)
One caveat on the history: both series show a one-month step in January 2025, with NDFI loans up $210.4bn and C&I loans down $102.6bn. That looks like reclassification rather than new lending, which is why the comparison above starts in January 2025. From that base, NDFI loans are up 49.6% against 12.2% for C&I.
Why the routing matters for credit risk
Bank exposure to a mid-market borrower funded by a direct lender is not the same as a bilateral C&I loan. The differences run in both directions:
- Structural seniority: a bank facility to a private credit fund (often a subscription line or asset-based facility) sits senior to the fund’s equity and is secured on a diversified loan pool. On paper, that is a safer position than lending directly to a single leveraged borrower.
- Transparency: the bank sees the pool through the NDFI’s reporting rather than through direct covenant monitoring. Early warning on individual borrowers arrives later and second-hand.
- Correlation: when one lender funds many NDFIs that hold overlapping borrowers, losses can cluster. Diversification at the fund level does not remove system-level concentration.
- Pricing: banks are already competing hard on price. In the July survey a net 26.8% of banks reported narrowing spreads over funding costs on large-firm C&I loans, which leaves less cushion if credit quality turns.
The October SLOOS shows banks are aware of this. They tightened standards, on net, for every category of NDFI loan queried, citing a less favorable economic outlook and weaker financial strength among NDFI borrowers. So banks are lending more to nonbanks while applying stricter terms to each new deal: volume growth with defensive underwriting.
Reading the signal correctly
For analysts, the October survey argues for three adjustments in how bank credit data are read:
- Do not read SLOOS demand as total corporate credit demand. A negative print can coexist with rising C&I balances and faster NDFI growth. Pair the survey with H.8 balances before drawing a recession signal.
- Track C&I and NDFI lines together. The relevant measure of bank exposure to corporate credit is increasingly the sum of direct C&I and indirect NDFI lending, not C&I alone.
- Watch standards on NDFI loans as the leading indicator. If banks keep tightening terms to nonbank lenders, the cost of private credit leverage rises, and that pressure eventually reaches the underlying mid-market borrowers.
Conclusion
The October SLOOS showed large-firm C&I demand swinging to -11.7% while standards barely moved, and banks attributed part of the drop to borrowers shifting to other lenders. The H.8 data show where that demand went: bank loans to nonbank financials rose 20.1% year on year to $2.11 trillion, faster than direct C&I lending. Bank exposure to corporate credit is not shrinking; it is becoming indirect.
Next to watch are the weekly H.8 releases, starting 20 November, for whether NDFI growth holds as banks tighten terms, and the next SLOOS, due early in 2027, for whether the substitution reason persists. A decline in NDFI balances alongside weak C&I demand would be the first sign that the routing has stopped and that underlying credit demand is genuinely weakening.
Sources: Federal Reserve, October 2026 Senior Loan Officer Opinion Survey; FRED: DRSDCILM, DRTSCILM, DRSDCIS, DRTSCIS, DRISCFLM, LNFACBM027SBOG, LNFACBW027SBOG, BUSLOANS, TOTCI (Federal Reserve H.8).
Daniel Panizo, CFA, FMVA



Leave a Reply