
For most of 2025, the gap between Brent and West Texas Intermediate (WTI) was a quiet number. The two benchmarks traded an average of $3.58 per barrel apart, roughly the cost of moving a cargo of US crude across the Atlantic. In 2026 that gap became one of the most volatile prices in energy. On October 2 the spot spread hit $37.62, with Brent at $135.51 and WTI at $97.89. Six weeks later, on November 11, it stood at $2.52.
The collapse matters beyond the headline price of oil. The Brent–WTI spread is the price of location: it sets whether US crude flows abroad, how much of a feedstock advantage US refiners hold, and how well a WTI hedge protects a producer selling into world markets. The speed of the unwind says a lot about what the market was pricing, and the level it has reached says even more about what comes next.
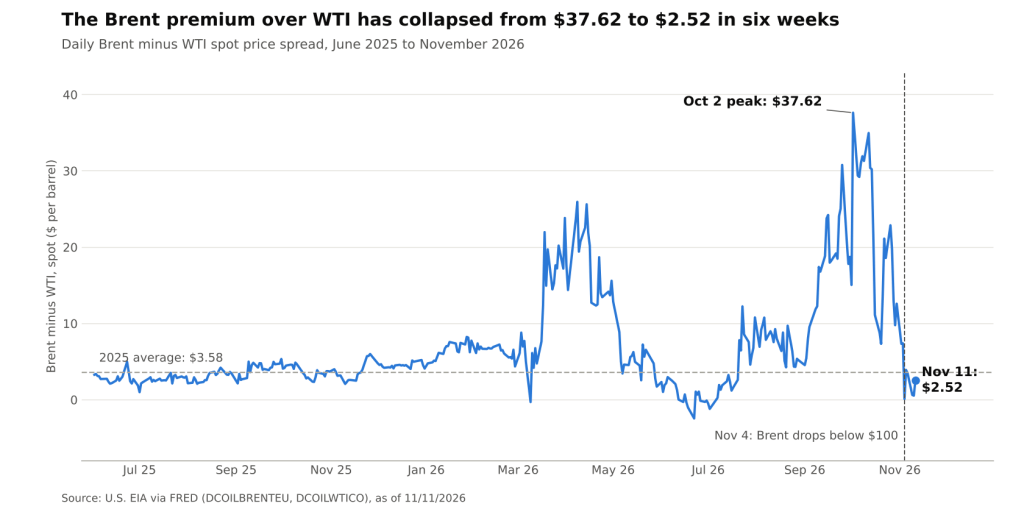
Daily Brent minus WTI spot spread, with the 2025 average as reference (U.S. EIA via FRED @ 11/11/2026)
What the Spread Was Pricing
Brent and WTI are both light, sweet crudes, so the spread between them is mostly about geography and logistics rather than quality. Three forces pushed it out this year:
- Exposure to the disruption. Brent prices waterborne crude that competes directly with Middle East supply. The EIA estimates that Middle East shut-ins peaked at 10.9 million b/d in May and were still 2.5 million b/d in October. WTI, priced at the landlocked Cushing hub, sits behind a domestic market producing a record 13.9 million b/d this year.
- Freight. Moving US barrels to the buyers who needed them got far more expensive. In late September, very large crude carrier (VLCC) freight to Asia was reported at about $50 million per voyage, against $16 million before the conflict, lifting the discount needed to make US exports work to roughly $8 per barrel from about $4.
- US policy risk. On September 25, talk of a possible US diesel export ban pushed WTI futures as much as $12.02 below Brent, on the logic that refiners unable to export product would run less crude at home.
One measurement point matters here. The figures in this post use EIA daily spot prices, i.e. physical Brent and physical WTI at Cushing. Spot spreads ran far wider than futures spreads during the stress: on the same September 25 that futures hit a $12.02 gap, the spot spread was $30.78. That difference is itself a signal, because physical Brent carried a premium for prompt, deliverable barrels that the futures curve only partly reflected.
Brent Did the Falling
The unwind was not a convergence from both sides. It was a repricing of the international barrel. Between October 2 and November 11, Brent spot fell $43.37 while WTI spot fell only $8.27. Narrowing the window to the post-election move makes the same point: from October 30 to November 11, Brent dropped $28.01 and WTI $17.94.
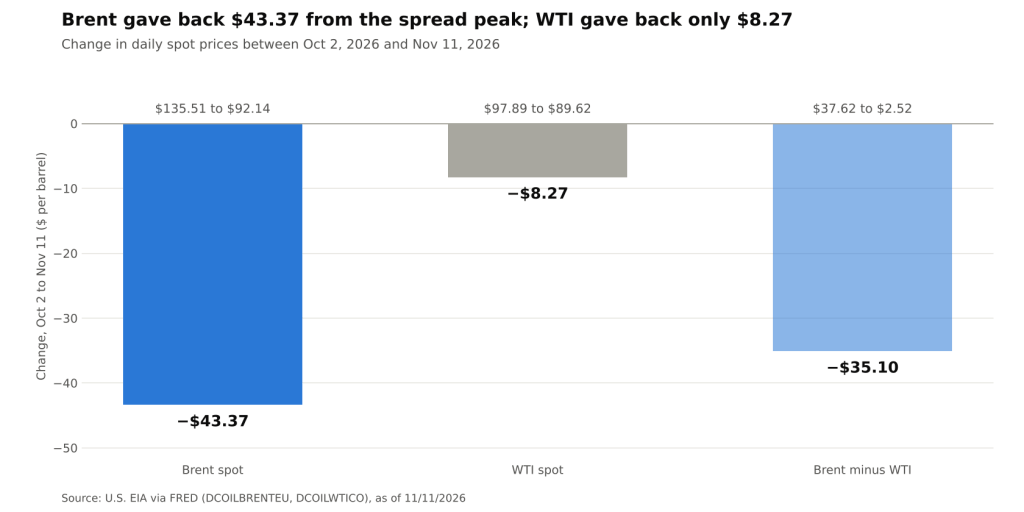
Change in Brent and WTI spot prices from the October 2 spread peak (U.S. EIA via FRED @ 11/11/2026)
The catalyst was a shift in perceived geopolitical risk. Press coverage tied the early-November selloff to hopes of a US–Iran diplomatic track after the midterm elections, with Brent and WTI futures falling about 16% and 13% respectively in the week of November 2–6. On November 4 the spot spread touched $0.11, with Brent at $91.84 and WTI at $91.73. A premium that averaged $21.86 across October was, for a day, gone.
This asymmetry is the core analytical point. Most of the risk premium in crude this autumn sat in the seaborne benchmark. US inland crude never fully priced the disruption, so it had far less to give back when the market began pricing de-escalation.
Why Near Zero Is an Unstable Level
A spread of $2.52 is below the 2025 average, yet the cost of shipping crude is still far above where it was in 2025. That combination should not last, because the spread is policed by the export arbitrage, i.e. the trade of buying crude in the US and selling it abroad when the price gap covers transport.
- When the spread is wide, exports pay. The EIA notes that US crude exports rose and imports fell in October because the wide Brent–WTI spread made exporting more attractive. That pull is one reason US commercial crude stocks ended October at 410 million barrels, the lowest end-of-October level since 2014.
- When the spread is below freight, the arbitrage shuts. With the reported break-even near $8 and the spot spread at $2.52, US barrels that would have sailed have a reason to stay home.
- Barrels that stay home build inventories, which weighs on WTI relative to Brent and tends to push the spread back out toward the cost of shipping.
In other words, the market has removed most of the geopolitical premium but has not yet re-priced the logistics premium. Unless freight rates fall back toward pre-conflict levels, a sub-$3 spread looks more like an overshoot of the risk unwind than a new equilibrium. The EIA’s own framing points the same way: in its November outlook it described the spread as wide but narrowing, with further narrowing tied to Middle East output recovering in 2027 rather than to a single month of de-escalation headlines.
Implications for Producers, Refiners and Hedgers
- US refiners. The crude cost advantage of running WTI-linked barrels against product prices set in world markets has largely disappeared. Margins now depend more on product cracks than on feedstock discounts.
- Producers. Companies selling at Brent-linked prices lost far more revenue per barrel in the unwind than US inland producers. Realized-price guidance built on October averages (Brent spot averaged $123.93, WTI $102.07) will look stale in fourth-quarter results.
- Hedgers. The episode is a reminder of basis risk, i.e. the gap between the hedge instrument and the exposure. A WTI hedge protected little of a Brent-linked seller’s upside in September and October, and a Brent hedge would have over-delivered for a Cushing seller in the unwind. Spot-versus-futures divergence added a second layer of basis.
- Forecasts. The EIA’s November outlook, finalized on November 5, put Brent at $104 for November and $99 for December, then $86 for 2027. Brent spot at $92.14 on November 11 was already well below the November figure, so the outlook’s near-term path is under pressure from the market itself.
Conclusion
The collapse of the Brent–WTI spread from $37.62 to $2.52 was mostly a story about Brent. The international barrel carried nearly all of this year’s disruption premium, and it shed that premium quickly once the market began pricing diplomacy. WTI, anchored by record domestic output, moved far less in both directions.
What to watch next is whether the logistics premium follows the geopolitical one. Key markers are VLCC freight rates, weekly EIA export and Cushing inventory data, and the EIA’s December 8 outlook. If freight stays elevated while exports slow, the spread has room to rebuild toward the cost of shipping; if shut-ins keep easing and freight normalizes, a spread nearer the 2025 average becomes sustainable.
Sources: FRED, Brent spot (DCOILBRENTEU); FRED, WTI spot (DCOILWTICO); U.S. EIA, Short-Term Energy Outlook, November 2026; Hydrocarbon Processing / Reuters, September 25, 2026; Reuters via GV Wire, November 13, 2026.
Daniel Panizo, CFA, FMVA



Leave a Reply