
When the Treasury set its November refunding at $125 billion on 4 November, the headline was what did not change. The 3-, 10- and 30-year auction sizes stayed where they were, and officials again said they expect to hold nominal coupon and floating-rate sizes for the next several quarters. The consequence sits a few pages deeper in the financing documents: with coupons fixed, the marginal dollar of federal borrowing falls on Treasury bills (i.e. government debt maturing within a year).
Treasury’s estimates imply $864 billion of net bill issuance from October 2026 through March 2027, against $709 billion of net coupon issuance, a category that here includes TIPS and floating-rate notes. Bills would supply 54.9% of the combined total, up from 31.1% across fiscal 2026. That shift arrives with the 3-month yield at 4.34% as of 16 November, 34bp above the top of the Federal Reserve’s target range.
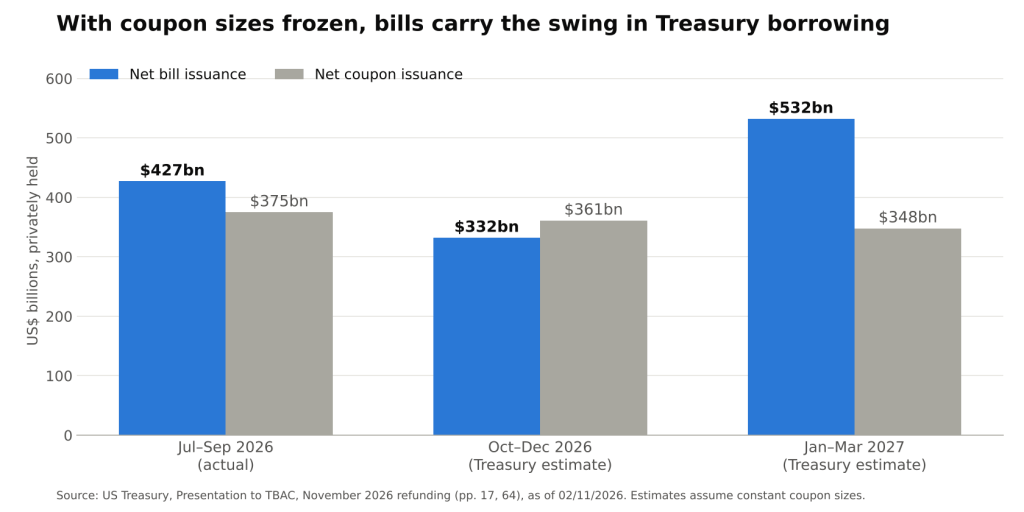
Privately held net bill and coupon issuance by quarter; the last two quarters are Treasury estimates at constant coupon sizes (US Treasury, TBAC presentation @ 02/11/2026)
The Arithmetic of a Frozen Coupon Calendar
The bill number is a residual. Treasury starts from its borrowing estimate, subtracts the net cash that existing coupon sizes will raise, and adds back planned buybacks (i.e. repurchases of its own outstanding debt, which must also be financed):
- October to December 2026: $618 billion of borrowing, less $361 billion of net coupons, plus $75 billion of buybacks, leaves $332 billion of bills.
- January to March 2027: $800 billion of borrowing, less $348 billion of net coupons, plus $80 billion of buybacks, leaves $532 billion of bills.
The quarterly split needs care, because the cash balance distorts it. Treasury assumes its account at the Fed falls from $984 billion at end-September to $850 billion at end-December, a $134 billion reduction that trims the first quarter’s need. It then assumes a rebuild to $1,000 billion by end-March, adding $150 billion to the second. Seasonality points the same way: the refunding statement flags cuts to shorter-dated bill auctions around the mid-December tax date and increases across the bill curve in January.
The 60.5% bill share implied for January to March should therefore not be extrapolated. The six-month figure is the cleaner read, and it still shows bills absorbing more than half of net supply. Treasury puts bills outstanding at about $7.4 trillion, or 23.0% of marketable debt, as of 2 November.
Bills Are Repricing, but Supply Is Not the Main Reason
It would be tempting to read the rise in bill yields as supply indigestion. The curve argues otherwise. Since 2 January, the 3-month yield has risen 69bp, from 3.65% to 4.34%, while the 2-year yield has risen 136bp, from 3.47% to 4.83%. The gap between the two has swung from -18bp to +49bp. Since the refunding announcement, the 2-year has again moved more, up 25bp against 13bp for the 3-month.
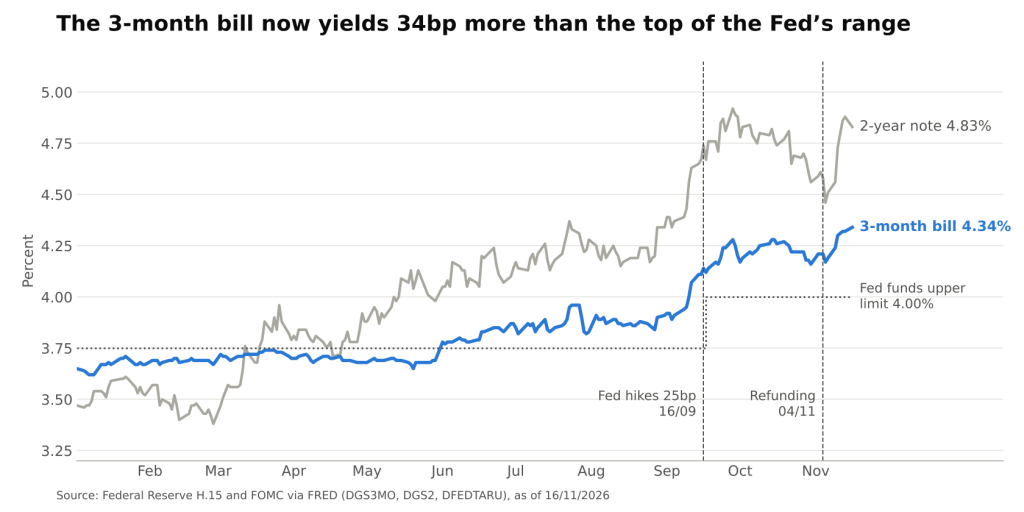
3-month and 2-year Treasury yields against the upper limit of the fed funds target range (Federal Reserve via FRED @ 16/11/2026)
That pattern fits a policy repricing. The FOMC raised its range to 3.75%-4.00% on 16 September and held on 28 October in a 10-2 vote, with both dissenters preferring another increase. A 3-month bill spans the coming policy meetings, so a yield 44bp above the 3.90% rate on reserve balances largely reflects the path investors expect, with any supply premium layered on top. The two effects cannot be separated cleanly from yields alone.
Auction results through early October also show no obvious strain. Between the issues settling on 9 July and 1 October, the 13-week stop-out rate rose 37.5bp to 4.110% and the 26-week rate rose 45.5bp to 4.285%. Yet primary dealers, the backstop buyers at auction, took only 26.3% and 30.2% of those respective 1 October issues. Investors were demanding higher rates, but they were still showing up.
The Fed Has Stepped Back From the Bid
The more important change in the supply picture is on the buying side. For the period from 15 January to 12 February, the New York Fed’s trading desk planned $40 billion of reserve management purchases (i.e. bill buying to keep bank reserves ample) plus $15.4 billion of reinvestments, for $55.4 billion in total. For 16 November to 11 December, it plans $14.0 billion of reinvestments and no reserve management purchases, a 74.7% decline. This is the fourth straight monthly period without them.
A simple comparison shows what that means for private balance sheets. Six monthly periods at the current pace would total $84 billion, or 9.7% of the projected $864 billion of net bills. At the early-2026 pace, the same six periods would have totaled $332.4 billion, or 38.5%. The comparison is illustrative, since the desk says its purchases are not on a preset course. Treasury’s own estimate that its cash balance could peak near $1.025 trillion, plus or minus $50 billion, in late November and late January matters here, because cash moving into that account drains bank reserves, all else equal, and could bring the purchases back.
What a Bill-Heavy Mix Changes
- Debt service sensitivity: each 25bp on a $7.4 trillion bill stock equals about $18.5 billion of annualized interest. Applying this year’s 69bp rise in the 3-month yield to the same stock gives roughly $51.1 billion, an illustration rather than a forecast, since actual rates vary across the bill curve.
- Policy transmission: a larger floating-like share ties federal interest costs more closely to the Fed’s path, so further tightening reaches the budget faster than it would through a longer-dated mix.
- Money markets: bills compete with repo (i.e. short-term secured lending) for the same cash, so heavy net supply with less Fed buying can keep upward pressure on front-end funding rates.
- Long-end supply: frozen coupon sizes spare the 10- and 30-year sectors additional issuance for now, but they defer that decision rather than remove it.
Conclusion
Treasury’s choice is coherent: bills absorb seasonal swings, demand has held up, and leaving coupon sizes alone avoids adding duration while long yields are elevated. The cost is greater rollover exposure at a moment when the Fed has been tightening and has paused its reserve-driven bill purchases. The yield move so far looks driven mainly by policy expectations, but the burden of absorbing supply is shifting to private buyers.
The next tests are the late-November cash peak and any short-dated cash management bill around it, the desk’s next purchase schedule after 11 December, the December FOMC meeting, the January step-up in bill auctions and the 3 February 2027 refunding, where any change in coupon guidance would alter this arithmetic directly.
Sources: US Treasury, Quarterly Refunding Statement; US Treasury, Presentation to TBAC; New York Fed, Treasury Securities Operational Details; Federal Reserve, FOMC statement; Federal Reserve, Implementation Note; FRED series DGS3MO, DGS2 and DFEDTARU.
Daniel Panizo, CFA, FMVA



Leave a Reply