
The minutes of the Federal Reserve’s October 27–28 meeting, released on November 18, show a committee that held the target range at 3.75–4.00% by a 10–2 vote, with two members preferring a hike and almost all participants judging that further increases would likely be appropriate. Some went further, arguing that the current stance was not restrictive enough. That claim can be tested with a simple instrument: the real policy rate, i.e. the nominal fed funds rate minus underlying inflation.
On that measure, the debate is less about how tight policy is than about whether it is tight at all. The effective fed funds rate averaged 3.88% in October, while core PCE inflation ran at 3.12% over the twelve months to September. The resulting real rate of about 0.76% sits below the roughly 1.2% real neutral rate implied by the Fed’s own longer-run projections, even after September’s hike.
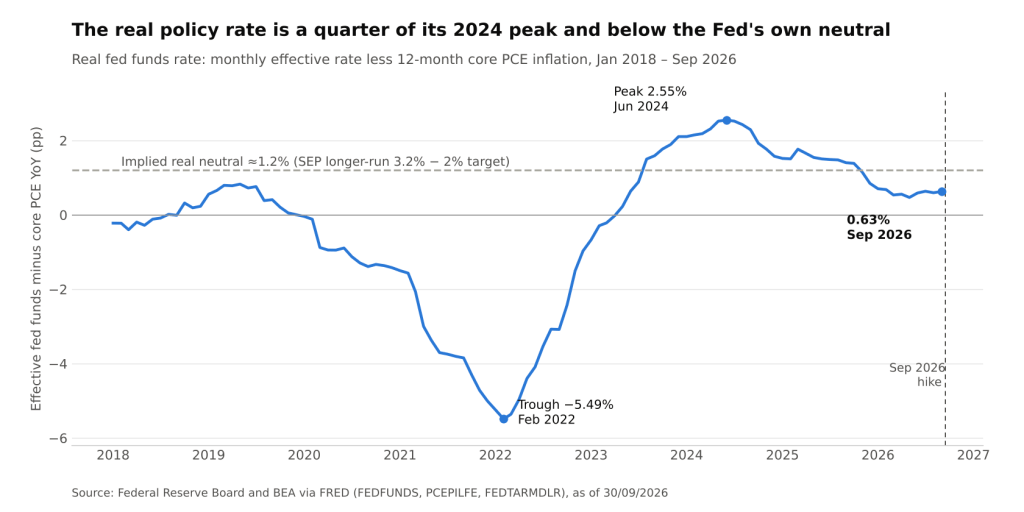
Real fed funds rate: monthly effective fed funds rate less 12-month core PCE inflation, with the implied real neutral rate (Federal Reserve Board and BEA via FRED: FEDFUNDS, PCEPILFE, FEDTARMDLR @ 30/09/2026)
How the Real Rate Fell While the Fed Hiked
The chart tells a story of two halves. Through 2024 the Fed held the effective rate at 5.33% while core inflation cooled, so the real rate climbed passively to a peak of 2.55% in June 2024. Policy was tightening without any action from the committee. The cuts that followed reversed that, and by early 2026 the effective rate had settled at 3.63–3.64%.
Then inflation turned. Core PCE inflation, which bottomed at 2.56% in March 2025, re-accelerated to 3.12% by September 2026. With the nominal rate flat, every tenth of a point of extra inflation eased real policy by the same amount. The real rate fell to a low of 0.47% in May 2026. September’s quarter-point hike only offset part of that drift: the real rate was 0.63% in September and about 0.76% using October’s effective rate against September inflation, roughly 179bp below the 2024 peak.
Three mechanics drive the result:
- Passive easing. When inflation rises and the nominal rate is unchanged, the real rate falls. A pause is therefore a loosening move whenever inflation is climbing.
- A higher yardstick. The median longer-run fed funds projection rose from 3.0% in December 2025 to 3.2% in September 2026. Subtracting the 2% inflation target gives a real neutral rate of about 1.2%, up from about 1.0%. The bar for restrictive policy rose as the real rate fell.
- Market estimates sit higher still. The minutes note that the median longer-run rate in the New York Fed Desk survey rose to about 3.4%, which implies a real neutral rate near 1.4%.
Measurement Choices Matter, but Not Enough to Change the Answer
The real policy rate is an estimate, and two choices move it. The first is the inflation measure. The trailing twelve-month rate of 3.12% is backward-looking; the three-month annualized rate of core PCE was a softer 2.90% in September. Using it raises today’s real rate to about 0.98%, closer to neutral but still below it. The staff’s own estimate in the minutes, 3.1% for September core PCE, matches the FRED-based calculation.
The second is the neutral rate itself, which cannot be observed. The Summary of Economic Projections (SEP) median is a committee median of individual long-run guesses, not a measured quantity, and the minutes explicitly flag uncertainty about the neutral rate. Even so, every reasonable combination of inputs points the same way: whether inflation is measured over three months or twelve, and whether neutral is taken from the SEP or the Desk survey, the current real rate sits at or below the low end of the neutral range. That is why a group of participants could argue that a 3.88% policy rate is not yet restrictive.
What It Would Take to Get Back Above Neutral
The second chart holds September inflation constant and asks how far each additional quarter-point step would lift the real rate. It is a mechanical exercise, not a forecast, but it frames the December debate.
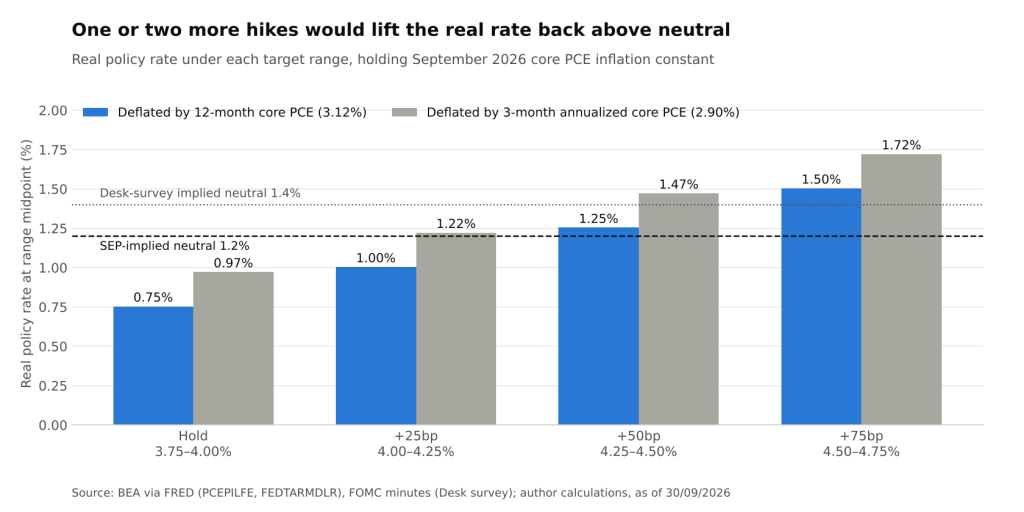
Real policy rate at each target range midpoint, with core PCE inflation held at its September 2026 rate (BEA via FRED: PCEPILFE, FEDTARMDLR; FOMC minutes; author calculations @ 30/09/2026)
- Hold at 3.75–4.00%. The real rate at the range midpoint is 0.75% on twelve-month inflation and 0.97% on the three-month rate. Both sit below the SEP-implied neutral of 1.2%.
- One hike to 4.00–4.25%. The real rate reaches 1.00% or 1.22%. On the softer inflation measure, this alone is enough to touch neutral. The September SEP median for end-2026 of 4.1% is consistent with this step.
- Two hikes to 4.25–4.50%. The real rate reaches 1.25% or 1.47%, above SEP neutral on both measures and around the Desk-implied 1.4%. This is close to the path futures were pricing at the time of the meeting: a hike by year-end and two more by summer 2027.
- Three hikes to 4.50–4.75%. The real rate reaches 1.50% or 1.72%, clearly restrictive on any of the benchmarks used here.
The exercise also shows why inflation data, rather than the dot plot alone, sets the pace. If core inflation drifted from 3.12% toward 2.90% without any change in policy, the real rate would rise by about 22bp, roughly the effect of one hike. If inflation stays sticky, the committee needs action just to keep the real stance from slipping again.
Implications for Rates and Credit
- Front-end pricing. If more members frame the debate in real terms, the case for further tightening rests mostly on arithmetic rather than on new evidence of overheating. That supports the hiking path already in futures and makes a pause in December harder to justify if inflation does not cool.
- Term structure. A higher neutral estimate lifts the anchor for longer-dated yields. The SEP path, which falls from 4.1% in 2026–27 to 3.9% in 2028 and 3.6% in 2029, still converges on a higher terminal level than a year ago.
- Borrowers. Floating-rate credit, including leveraged loans and private credit, reprices with the nominal rate. The minutes already describe wider speculative-grade spreads and forward-looking credit measures that deteriorated somewhat. Moving the real rate back above neutral would add cost pressure on those borrowers just as riskier firms face mounting pressure to refinance.
Conclusion
The October minutes describe a Fed that thinks it still has work to do, and the real-rate arithmetic explains why. At about 0.76%, the real policy rate is less than a third of its 2024 peak and below the 1.2% neutral level implied by the committee’s own projections. Re-accelerating inflation, not rate cuts, did most of the easing in 2026, and September’s hike only partly reversed it.
The next tests come quickly. October PCE data are due on November 25, ahead of the December 8–9 meeting and its new projections. Three things are worth watching: whether three-month core inflation keeps running below the twelve-month rate, whether the longer-run dot moves above 3.2%, and whether the committee starts describing its stance in real rather than nominal terms.
Sources: Minutes of the FOMC, October 27–28, 2026; FRED, Federal Funds Effective Rate (FEDFUNDS); FRED, Core PCE Price Index (PCEPILFE); FRED, Longer-Run SEP Fed Funds Median (FEDTARMDLR); FRED, SEP Fed Funds Median (FEDTARMD).
Daniel Panizo, CFA, FMVA



Leave a Reply