
For most of 2026, the US and euro high yield markets have priced credit risk at almost the same level. The ICE BofA Euro High Yield Index started the year at an option-adjusted spread (OAS, i.e. the yield premium over government bonds after adjusting for embedded call options) of 270bp, against 281bp for its US counterpart. As of 18 November the two sit at 339bp and 347bp. Both have widened by almost exactly the same amount this year: 69bp in euros and 66bp in dollars.
The all-in yields tell a very different story. As of 17 November the US index yielded 8.31% and the euro index 6.59%, a gap of 172bp, up from 144bp at the start of the year. The October episode, when euro spreads briefly blew out well past US levels, has passed. It leaves behind a useful lesson for cross-border credit work: the extra yield on US junk is mostly compensation for US rates, not for US credit risk. That matters this week, as the ECB’s November Financial Stability Review warns that debt-funded AI investment could carry an equity correction into bond markets.
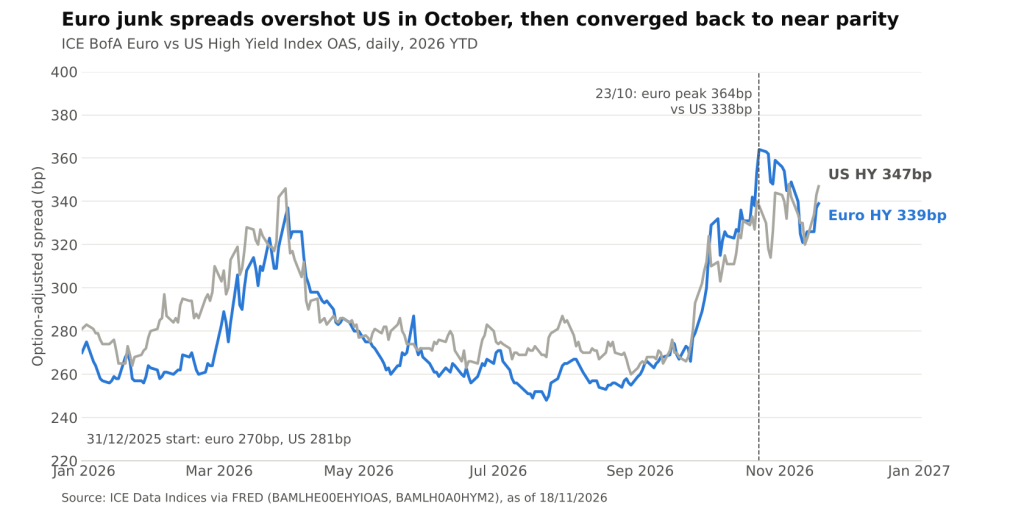
ICE BofA Euro vs US High Yield Index OAS, 2026 year to date (ICE Data Indices via FRED @ 18/11/2026)
The October Overshoot
Through the summer months, euro high yield traded consistently tighter than the US. Euro spreads reached their 2026 low of 248bp on 22 July, while US spreads bottomed at 260bp on 28 August. By 23 September the two were close together, at 266bp and 273bp respectively.
Then the euro market repriced faster. Between 23 September and 23 October, euro spreads widened by 98bp to a 2026 peak of 364bp. US spreads widened by 65bp over the same window, to 338bp. On 27 October the euro index traded 44bp wider than the US, the largest euro discount in the year-to-date data.
The reversal came just as quickly. The US index reached its own peak of 348bp on 5 November, while euro spreads were already retracing. By 18 November euro high yield had recovered 25bp from its peak, while the US was 9bp wider than on 23 October. The gap is now back to a US premium of 8bp, close to the 11bp it started the year at.
Three features of the episode stand out:
- Speed, not level. The euro market moved furthest, but the move did not stick. A month later, relative pricing was roughly where it began.
- Common driver. Both indices widened together from late September. That points to a shared risk-off shock rather than a purely regional credit event, with the euro market showing the sharper price swing.
- Convergence, not decoupling. On a year-to-date basis the widening is almost identical across the Atlantic, at 69bp versus 66bp.
Where the 172bp Actually Comes From
With spreads near parity, the question is why a US junk index yields so much more than a euro one. A simple decomposition helps. An index’s effective yield is roughly its OAS plus the yield of the government curve it is measured against. Subtracting the OAS from the effective yield therefore leaves an implied base rate, the risk-free part of the yield.
On that basis, the US implied base rate rose from about 3.72% at the end of 2025 to 4.88% on 17 November. The euro equivalent rose from 2.39% to 3.22%. The base-rate gap thus widened from 133bp to 166bp, while the spread gap narrowed from 11bp to 6bp. Of the 28bp increase in the yield gap this year, all of it, and slightly more, came from rates.
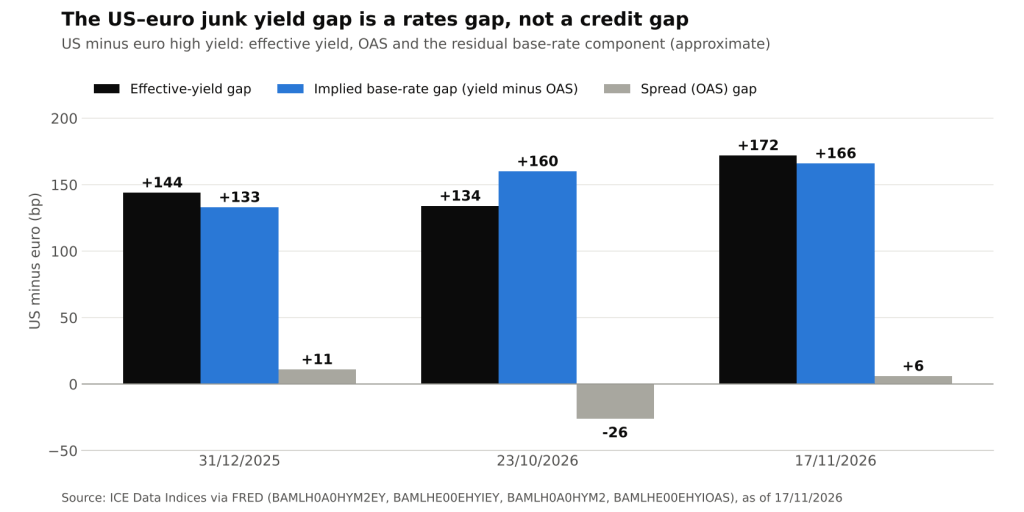
US minus euro high yield: effective-yield, spread and implied base-rate gaps (ICE Data Indices via FRED @ 17/11/2026)
The 23 October snapshot makes the point most clearly. At the height of the euro sell-off, euro high yield paid 26bp more spread than US high yield. Yet the US index still yielded 134bp more (8.14% versus 6.80%) because the base-rate gap was 160bp. Even when euro credit was being priced as the riskier market, it remained the lower-yielding one.
The decomposition is an approximation, and three caveats apply:
- Index composition. The two indices differ in duration, rating mix and sector weights, so equal spreads do not imply identical credit risk.
- Curve point. The implied base rate blends the government curve across each index’s maturity profile. It is not a single benchmark yield.
- Currency. The comparison is in local currency. For an investor who hedges currency risk, much of a rate differential tends to be given back through the cost of the hedge, which is driven by short-term rate differentials.
Implications for Cross-Border Credit Analysis
For analysts comparing the two markets, the 2026 data suggest a few practical points:
- Compare spreads for credit, yields for funding. The headline yield gap says little about relative default compensation. On spreads, the two markets currently price credit risk within single digits of each other.
- Higher US yields are mainly a rates exposure. The US implied base rate rose by about 116bp this year, against about 83bp in euros. Most of the extra income on US junk comes with US duration risk attached.
- The euro market showed higher beta to the October shock. Euro high yield moved further in the risk-off episode, and retraced faster too. Relative-value signals built on short windows can mislead.
- Issuer refinancing costs diverge. For a sub-investment-grade issuer able to borrow in either market, the cost difference is largely a base-rate question. That supports cross-currency issuance where swap and hedging costs allow it.
The Policy Backdrop
The ECB’s November 2026 Financial Stability Review, published on 18 November, frames the risk that matters for both markets. It notes that AI infrastructure is increasingly funded with debt, so a shift in sentiment could spread losses from equities to bonds. It also says vulnerabilities are more pronounced in certain non-banks. Both points apply to high yield on either side of the Atlantic. A common shock would most likely widen spreads together, as in October, rather than open a lasting gap between them.
What would change the picture is a divergence in base rates. If the euro and US government curves moved further apart, the yield gap would shift with them even if credit pricing stayed in step. For this reason the recent widening of the base-rate gap, from 133bp to 166bp, deserves as much attention as the spread charts.
Conclusion
US and euro high yield now price credit risk almost identically, at 347bp and 339bp as of 18 November, after a sharp but short-lived euro overshoot in October. The 172bp yield advantage of US junk is almost entirely a rates premium. This year it has grown because of rates, not credit.
The things to watch are whether euro spreads hold near parity with the US if risk appetite fades again, and whether the gap between the two government curves keeps widening. Tracking the spread gap and the base-rate gap separately, rather than the headline yield difference, is the cleaner way to read either move.
Sources: ICE BofA Euro High Yield OAS (FRED); ICE BofA US High Yield OAS (FRED); ICE BofA US High Yield Effective Yield (FRED); ICE BofA Euro High Yield Effective Yield (FRED); ECB Financial Stability Review press release, 18 November 2026.
Daniel Panizo, CFA, FMVA



Leave a Reply