
Walmart’s third quarter of fiscal 2027 (the three months to October 31, 2026), reported on November 19, read well on the income statement: total revenues of $188.8 billion, up 5.2%, reported operating income up 16.0% and a second upgrade to full-year guidance. The cash flow statement tells a more demanding story. Over the first nine months of the fiscal year, free cash flow (i.e. operating cash flow minus capital expenditures) fell 23% to $6.8 billion, while dividends and buybacks rose to $13.7 billion.
That combination matters for anyone valuing a mature compounder on free cash flow yield. A company returning roughly 2.0x its free cash flow has to fund the difference somewhere, and Walmart’s balance sheet shows where: total debt reached $64.3 billion. The question is whether this is a temporary investment hump that the returns justify, or a structural change in how much of Walmart’s earnings ever reach the owners as cash.
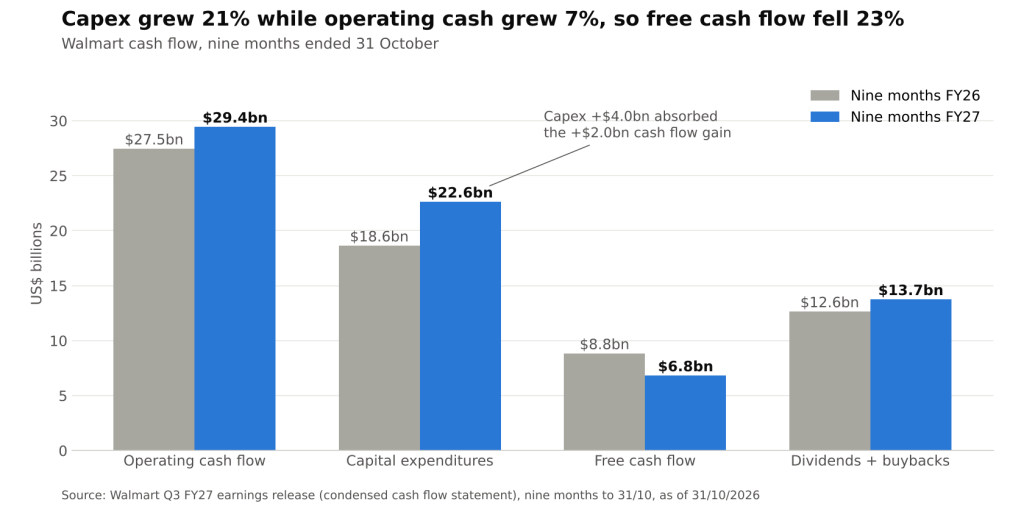
Walmart nine-month operating cash flow, capex, free cash flow and shareholder returns, FY26 vs FY27 (Walmart Q3 FY27 earnings release @ 31/10/2026)
Capex Outran Operating Cash
Operating cash flow was not the problem. Net cash from operations rose $2.0 billion, or 7.2%, to $29.4 billion for the nine months. Capital expenditures, however, rose $4.0 billion, or 21.4%, to $22.6 billion. The company attributes the increase to supporting its omnichannel growth strategy, the same build-out behind eCommerce sales that grew 17% globally in the quarter.
Three ratios frame the size of the step-up:
- Capex intensity: nine-month capex equaled 4.1% of net sales, against 3.6% a year earlier. Full-year guidance is now about 4.0% of net sales, up from roughly 3.5% in the original February outlook.
- Capex to depreciation: spending ran at 1.92x depreciation and amortization of $11.8 billion, up from 1.78x. Capex exceeded D&A by $10.9 billion, versus $8.2 billion a year earlier, which is the portion that is growth investment rather than upkeep.
- Cash conversion: free cash flow equaled 39.8% of consolidated net income of $17.1 billion, down from 49.4%.
Working capital also took more cash. Inventories absorbed $11.9 billion over nine months, against $8.2 billion a year earlier, and higher payables offset only part of it: the net inventory-minus-payables drag was $3.1 billion, versus $0.9 billion. Period-end inventory stood at $70.6 billion, up 8.1%, which the company links to strategic initiatives, the timing of seasonal events such as Flipkart’s Big Billion Days and cost inflation. The release also credits part of the operating cash gain to the timing of certain payments, a reminder that nine-month cash figures can swing on calendar effects.
Paying Out Twice the Free Cash Flow
Shareholder distributions moved in the opposite direction. Dividends paid rose to $5.9 billion and share repurchases to $7.8 billion, for a total of $13.7 billion. Against $6.8 billion of free cash flow, that leaves a gap of $6.9 billion, nearly double the $3.8 billion gap in the same period a year earlier, when payouts were 1.43x free cash flow.
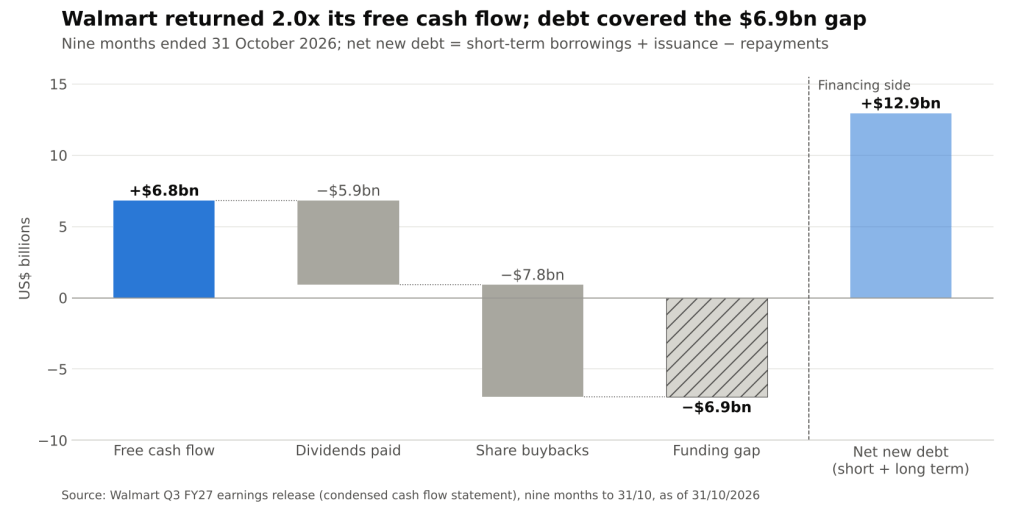
Walmart nine-month FY27 free cash flow, dividends, buybacks and net new debt (Walmart Q3 FY27 earnings release @ 31/10/2026)
The financing section of the cash flow statement shows how the gap was closed. Short-term borrowings rose by a net $5.7 billion, the company issued $10.8 billion of long-term debt (including $6.5 billion in the third quarter) and repaid $3.6 billion. Net new debt of $12.9 billion covered the payout gap, a $1.0 billion acquisition outflow and other financing items, and still lifted cash to $13.4 billion. On the balance sheet, total debt including finance leases rose $11.2 billion year over year, and third-quarter interest on debt was up 15.1%.
For a company of Walmart’s scale and cash generation, this is not a solvency issue. It is a capital allocation signal: buybacks are currently being financed at the margin with debt rather than with surplus cash, which means some of the per-share earnings growth investors see comes from leverage rather than operations.
The Case for the Investment: Returns Are Rising
The counterargument sits in Walmart’s own return metric. Return on investment (ROI, a non-GAAP measure of operating income plus interest income, D&A and rent over average invested capital) rose to 15.4% for the trailing twelve months, from 14.8%, a gain of 60bp. The numerator grew 13.6% while average invested capital grew 9.2%, so the incremental capital has so far earned more than the existing base.
Two caveats temper that reading:
- Flattered comparison: the trailing ROI and the 16.0% reported operating income growth both benefit from lapping a $722 million share-based compensation charge at PhonePe a year earlier. On an adjusted constant-currency basis, third-quarter operating income grew 5.5%.
- Depreciation lag: the cost of today’s capex reaches the income statement over years. Walmart U.S. already reported 45bp of operating expense deleverage in the quarter, driven mainly by depreciation and higher claims costs. Return on assets, which uses net income, fell to 7.2% from 8.4%, though fair-value losses on equity investments drove much of that drop.
What Analysts Should Model
The practical implication is that Walmart’s free cash flow yield and its earnings yield are drifting apart, and the spread depends on one assumption: how long capex stays above 4% of sales. Three scenarios are worth separating:
- Investment hump: capex intensity normalizes toward the mid-3% range after automation and delivery build-outs, free cash flow conversion recovers toward its prior level, and the debt raised this year looks like bridge financing for buybacks.
- Permanent step-up: omnichannel retail proves structurally more capital intensive, capex stays near 2x D&A, and the sustainable payout shrinks unless buybacks are cut or leverage keeps rising.
- Returns validate the spend: high-margin income from advertising and membership keeps ROI climbing, so higher capex is accompanied by faster operating cash growth and the gap closes from the top line.
In a discounted cash flow, the difference between the first two scenarios is large because it changes the reinvestment rate built into terminal value. A model that capitalizes current earnings at a fixed multiple implicitly assumes the first or third scenario.
Conclusion
Walmart’s nine-month numbers show a business generating more operating cash than a year ago but spending $4.0 billion more on capex, leaving $6.8 billion of free cash flow against $13.7 billion of dividends and buybacks. Debt filled the difference. Rising ROI suggests the investment is earning its keep for now, but part of that improvement reflects an easy comparison.
The next test is the fourth quarter, when the holiday inventory build should unwind into sales. Watch fourth-quarter free cash flow, the fiscal 2028 capex guide in February relative to the current 4.0% of sales, and whether buyback pace adjusts if the payout gap persists.
Sources: Walmart Q3 FY27 earnings release and financial statements (November 19, 2026); Walmart investor relations events.
Daniel Panizo, CFA, FMVA



Leave a Reply