
The 10-year Treasury yield averaged 5.13% in October 2026, up from 4.13% in February, a full percentage point in eight months. The headline story has been inflation: an energy shock, sticky prices and a Federal Reserve that raised rates on 16 September for the first time since 2023, lifting the target range to 3.75%–4.00%. Yet the bond market’s own split of that move tells a different story. Almost none of the selloff came from higher inflation expectations. It came from real yields, i.e. the inflation-adjusted return investors demand to lend to the US government for ten years.
That distinction matters for anyone pricing duration, discounting cash flows or setting a cost of capital. A selloff driven by inflation fears behaves differently, and unwinds differently, from one driven by a higher real cost of money. The data from FRED make the decomposition straightforward.
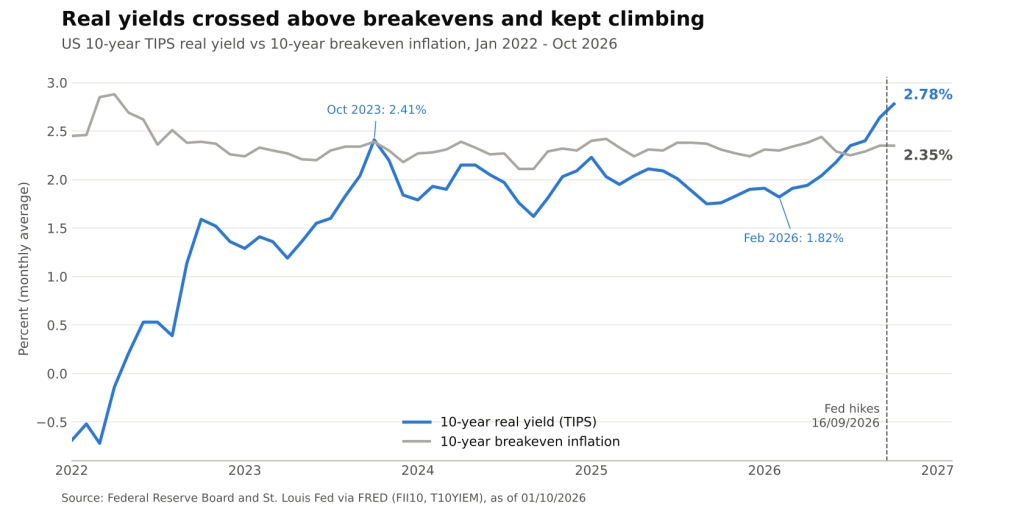
US 10-year TIPS real yield vs 10-year breakeven inflation, monthly averages (Federal Reserve Board and St. Louis Fed via FRED, FII10 and T10YIEM @ 01/10/2026)
Splitting the 10-Year Into Its Two Parts
A nominal Treasury yield can be read as two components: the yield on an inflation-protected Treasury (TIPS) of the same maturity, which is the real yield, plus the breakeven inflation rate, i.e. the average inflation rate at which an investor would be indifferent between the two bonds. Breakevens are a market-implied, not survey-based, gauge of expected inflation, and they also carry an inflation risk premium and some liquidity noise.
Comparing monthly averages for February and October 2026:
- Nominal 10-year: from 4.13% to 5.13%, a rise of 100bp.
- 10-year real yield: from 1.82% to 2.78%, a rise of 96bp.
- 10-year breakeven: from 2.30% to 2.35%, a rise of only 5bp.
The components do not add up to the basis point because FRED builds the breakeven series from Treasury Department yields while the other two come from the Fed’s H.15 release, but the conclusion is unambiguous: roughly 96% of the selloff was real. Investors did not demand much more compensation for future inflation. They demanded a much higher return after inflation.
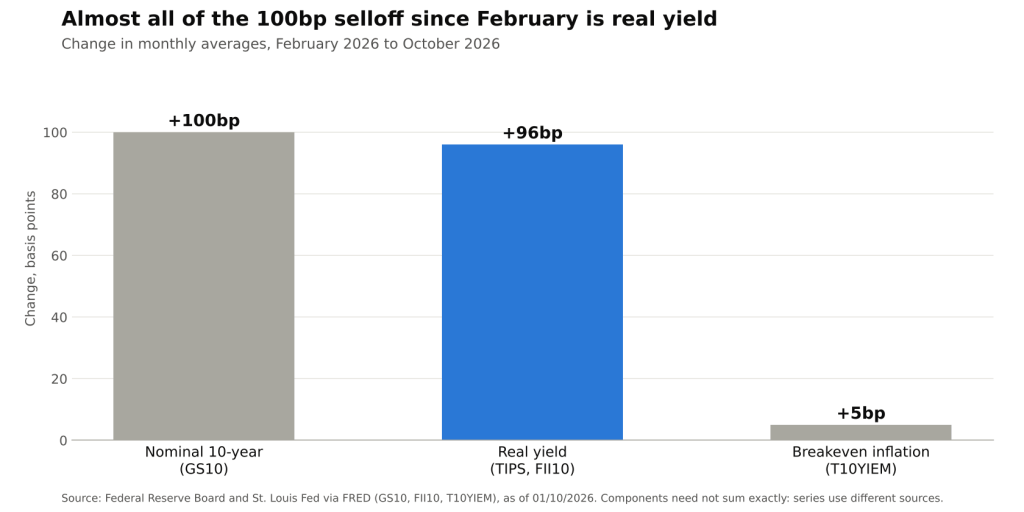
Change in US 10-year nominal yield, real yield and breakeven inflation, February to October 2026 monthly averages (Federal Reserve Board and St. Louis Fed via FRED, GS10, FII10 and T10YIEM @ 01/10/2026)
How High Is High
The October average real yield of 2.78% is above the 2.41% monthly average reached in October 2023, the peak of the previous selloff, and it is the highest monthly reading since November 2008, when forced selling of TIPS during the financial crisis pushed the average to 2.89%. The contrast with recent history is stark: in January 2022 the same series averaged -0.69%.
Daily data show the move has not reversed in November. The 10-year real yield stood at 2.88% on 19 November, about 10bp above its October average, while the nominal 10-year was 5.07% on 18 November. Breakevens have moved the other way: the 10-year breakeven slipped from 2.21% on 17 November to 2.15% on 20 November, and the 5-year, 5-year forward inflation rate, i.e. expected average inflation for the five years starting five years from now, was 2.10% on 19 November. In other words, the market’s long-run inflation anchor looks intact, close to the Fed’s 2% target, even as the real price of money keeps rising.
What Is Driving Real Yields
Real yields reflect two broad forces: the expected path of inflation-adjusted short rates and the term premium, i.e. the extra return investors want for locking money up for ten years rather than rolling short bills. Both appear to be at work.
- A more hawkish policy path. The September hike was accompanied by projections in which the median end-2026 fed funds rate rose to 4.1% from 3.8% in June, and the Fed raised the interest rate on reserve balances to 3.90%. When the market prices a higher policy rate while long-run inflation expectations stay put, the adjustment shows up almost one-for-one in real yields.
- Credibility working as intended. Flat breakevens are, in part, the payoff for tightening. If investors believed the Fed would tolerate higher inflation, breakevens would have widened and real yields would have lagged. The opposite happened.
- Term premium and supply. Real yields can also rise when investors need more compensation to absorb duration, for instance because of heavy Treasury issuance or uncertainty about fiscal and policy direction. The FRED series used here cannot separate this from rate expectations, so the split between the two remains an open question rather than a measured fact.
Why the Composition Matters
A 100bp selloff led by real yields carries different implications than one led by breakevens:
- Discount rates bite harder. Equity and real-asset valuations are most sensitive to real rates because cash flows that grow with inflation are partly protected from breakeven moves, but not from a higher real discount rate. Long-duration assets, where most value sits far in the future, absorb the largest hit.
- Cost of capital rises in real terms. For corporate finance, a risk-free rate that is higher in real terms lifts WACC without any offsetting boost to nominal revenue growth. Projects that cleared hurdle rates at a 1.8% real risk-free rate may not clear them at 2.8%.
- TIPS did not hedge this selloff. Inflation-linked bonds protect against rising breakevens, not rising real yields. With breakevens nearly unchanged, TIPS and nominal Treasuries of similar duration lost value together.
- Tighter financial conditions without an inflation scare. Higher real yields restrict demand directly, which is the channel the Fed wants. That also means the bond market has done part of the Fed’s work, a point likely to feature in policy debates ahead of the December meeting.
Conclusion
The 10-year Treasury’s climb above 5% has been a real-rate story. Between February and October 2026, real yields rose 96bp against a 100bp rise in the nominal yield, while 10-year breakevens moved just 5bp and long-run forward inflation expectations sit near 2.1%. Markets are pricing a higher real cost of money, not a loss of faith in the inflation target.
The key indicators to watch are whether the 10-year real yield holds near or above 2.9%, whether breakevens keep drifting lower as policy tightens, and how the December projections reshape the expected policy path. A renewed widening in breakevens would signal that the inflation narrative is back in charge; continued real-yield strength would confirm that the market is repricing the price of time itself.
Sources: FRED, 10-Year Treasury Constant Maturity (GS10, DGS10); FRED, 10-Year TIPS Constant Maturity (FII10, DFII10); FRED, 10-Year Breakeven Inflation Rate (T10YIE, T10YIEM); FRED, 5-Year, 5-Year Forward Inflation Expectation Rate (T5YIFR); Federal Reserve, FOMC statement, 16 September 2026; Federal Reserve, Implementation Note, 16 September 2026; Stock Analysis, summary of September 2026 Fed projections.
Daniel Panizo, CFA, FMVA



Leave a Reply