
The October CPI report, released on 10 November, carried a detail that deserves more attention than the headline. The electricity index rose 0.9% in the month on a seasonally adjusted basis, against 0.4% for all items, i.e. power prices climbed at 2.25 times the pace of the overall basket. That would be unremarkable if fuel were getting more expensive. It is not. The Henry Hub spot price averaged $2.99/MMBtu in October, and natural gas still sets the marginal price of power across much of the US grid.
Measured from the August 2022 gas peak, the gap is stark. Henry Hub has fallen 66% (from $8.81 to $2.99), while the CPI electricity index has risen 18.4%, outpacing the all-items CPI at 14.4%. The retail power bill has decoupled from the fuel that used to drive it. For anyone analyzing utilities, power producers or inflation, the question is what has taken fuel’s place as the price driver, and whether it reverses as easily as gas does.
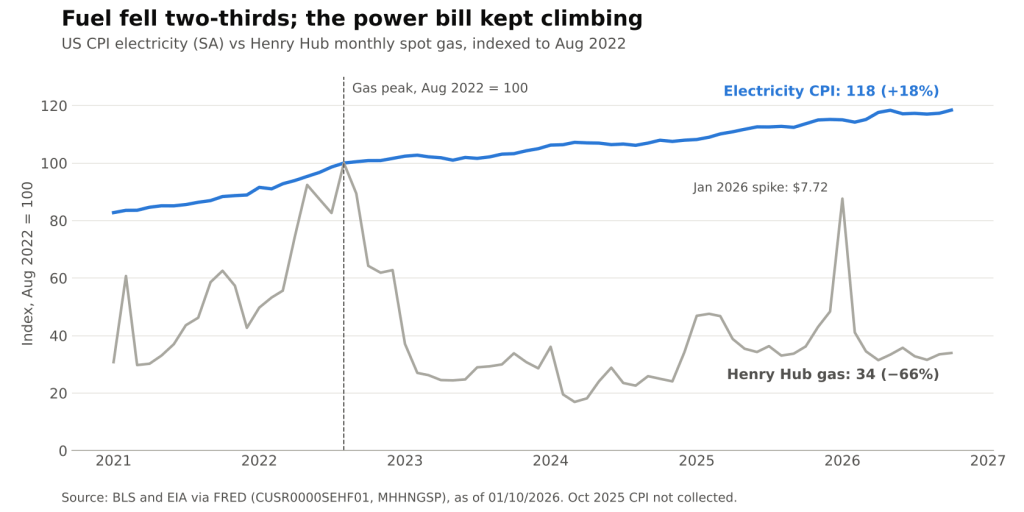
US CPI electricity (seasonally adjusted) vs Henry Hub monthly spot natural gas, both indexed to August 2022 = 100 (BLS and EIA via FRED @ 01/10/2026)
Why the Fuel Link Broke
A retail electricity bill bundles three broad cost layers: the energy itself (fuel and wholesale power), capacity (payments to keep enough generation available for peak demand) and delivery (transmission and distribution, i.e. the wires). Only the first layer moves with gas. The other two are set by regulators, multi-year auctions and the utility’s rate base, i.e. the regulated asset value on which it earns a return.
During the 2021–2022 gas spike, the energy layer dominated and bills tracked fuel. Since then, the composition has shifted toward the layers that do not fall when gas does:
- Capacity costs have repriced. In the largest US market, capacity payments rose roughly elevenfold in two auctions (detailed below) and are now flowing into retail rates as each delivery year begins.
- Wires spending is compounding. Grid investment enters the rate base and is recovered over decades, so each year’s capital spending lifts rates for many years after.
- Fuel savings arrive with a lag and get diluted. Lower gas costs pass through fuel-adjustment clauses, but they offset only the energy share of the bill, a share that is shrinking.
The lag also runs the other way. January 2026 showed how quickly fuel can still bite: Henry Hub averaged $7.72 that month before falling back to an average of about $3.01 from February to October. The electricity index barely registered the spike, which tells analysts the energy layer is now a smaller share of the price.
The Capacity Layer: PJM as the Case Study
PJM Interconnection, the grid operator serving 13 states and Washington, D.C., runs a Base Residual Auction (BRA) to buy capacity for delivery years starting roughly two to three years ahead. Its results show how quickly a non-fuel cost can reprice.
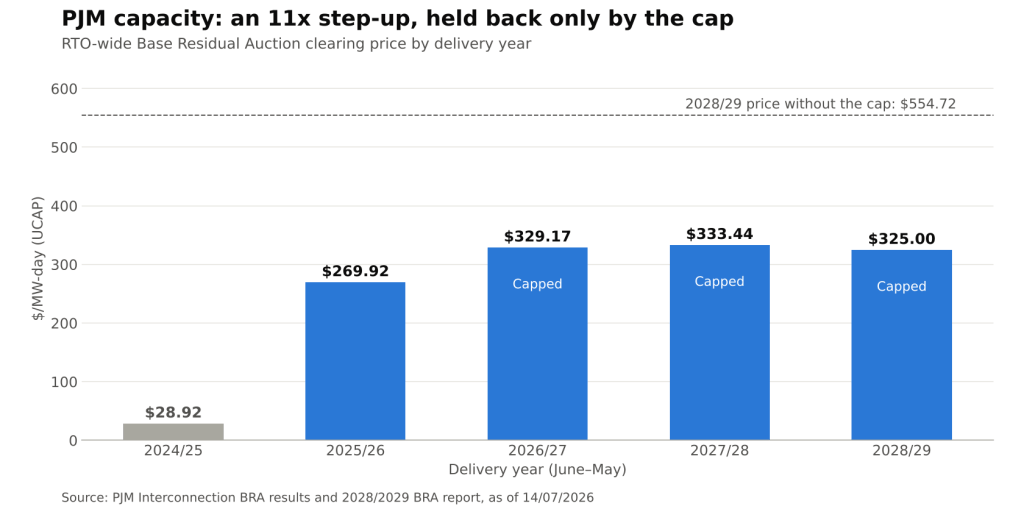
PJM RTO-wide Base Residual Auction clearing price by delivery year, $/MW-day UCAP (PJM Interconnection @ 14/07/2026)
The RTO clearing price went from $28.92/MW-day for 2024/25 to $269.92 for 2025/26, then to $329.17 and $333.44. The 2028/29 auction, held in July, cleared at the FERC-approved cap of $325.00 across the entire footprint, the third consecutive auction under the price collar. In annual terms, a megawatt of cleared capacity now earns about $118,625 a year, against about $10,556 at the 2024/25 price.
Three details from PJM’s 2028/29 report matter for the outlook:
- The cap is binding, not decorative. PJM’s simulation without the collar produced a clearing price of $554.72, about 71% above the capped result.
- Supply is not responding fast enough. The auction cleared only 525 MW of new generation and uprates, and total cleared capacity fell 6,831 MW short of the reliability requirement.
- The bill is large. Cleared supply multiplied by the clearing price totals about $16.4 billion for the delivery year, although PJM notes that not all of it is a cost to load, since self-supplied and bilaterally contracted volumes are not exposed to the auction price.
Capacity prices are set years before delivery and roll into retail rates as each June delivery year begins. That makes this layer sticky: a cheaper gas month does nothing to it, and the capped price effectively locks in today’s level through the end of the collar period.
What the Forecasts Imply
The EIA’s November Short-Term Energy Outlook, released on 10 November, puts the average US residential electricity price at 17.2¢/kWh in 2025, 18.2¢ in 2026 and 18.7¢ in 2027. That is a 5.8% rise this year and a further 2.7% next year. The same outlook expects record generation of almost 4,390 billion kWh in 2026, up 2.7%, with growth led by the commercial sector, the category that includes data centers.
Crucially, the EIA sees this happening alongside cheap gas. It forecasts Henry Hub at $2.87/MMBtu on average from November through March, and gas storage stood 80 Bcf above the five-year average as of 13 November. Gas still supplies close to 40% of US generation in the EIA’s forecast, so the fuel input stays cheap while the retail price keeps climbing. That is the decoupling in forecast form.
Implications for Analysis
- Inflation. Electricity carries a relative importance of 2.513 in the CPI, about one-fortieth of the basket. It is small, but it has been running above headline inflation and, unlike gasoline, it will not reverse with a fall in commodity prices. A cheap-gas winter therefore removes less inflation than it used to.
- Regulated utilities. Rising rates driven by capacity and wires investment support rate-base growth, but they also raise affordability pressure, which tends to show up in rate cases, regulatory pushback and political scrutiny of who pays for grid expansion.
- Generators. For owners of dispatchable capacity in PJM, revenue has shifted from energy margins, which follow gas, toward capacity payments, which are now fixed at or near the cap for several delivery years. That changes their earnings volatility and their sensitivity to fuel.
- Gas as a hedge. Treating natural gas as a proxy for power costs, whether in corporate budgeting or in inflation models, now carries more basis risk, i.e. the risk that the hedge and the exposure move apart.
Conclusion
Since August 2022, US gas prices have fallen by two-thirds while household electricity prices have risen faster than overall inflation. The driver has moved from fuel to capacity and delivery costs, which are set by auctions and regulators over multi-year horizons. PJM’s capacity price, now at the cap after an elevenfold rise, is the clearest example of that new, stickier layer.
Three things are worth watching next: PJM’s 2029/30 auction scheduled for December, which will again clear under the collar; the EIA’s December outlook on 8 December for revisions to the 2027 retail price path; and the November CPI, which will show whether October’s 0.9% jump in electricity was an outlier or the trend.
Sources: BLS CPI electricity via FRED (CUSR0000SEHF01); BLS CPI-U via FRED (CPIAUCSL); EIA Henry Hub spot via FRED (MHHNGSP); BLS, Consumer Price Index, October 2026; EIA, Short-Term Energy Outlook, November 2026; EIA press release, 10 November 2026; PJM, 2028/2029 Base Residual Auction Report; PJM Inside Lines, 2028/2029 BRA results; PJM Inside Lines, 2025/2026 BRA results.
Daniel Panizo, CFA, FMVA



Leave a Reply