
Target’s third-quarter report on November 18 looked like the turnaround the market had been waiting for: net sales up 7.1%, comparable sales up 5.6% on a 5.0% rise in traffic, operating income up from $1.1 billion (adjusted) to $1.7 billion, and trailing after-tax return on invested capital (ROIC) of 16.5%, up from 13.4% a year earlier. Underneath, part of that improvement came not from stores but from Washington.
Since the Supreme Court ruled on February 20 that the International Emergency Economic Powers Act (IEEPA) did not authorize the emergency tariffs, importers have been recovering duties they paid. Target books those recoveries as a reduction of cost of sales, so they flow straight into gross margin, operating income and ROIC. The company discloses the effect line by line, which makes it possible to separate the operating story from the windfall. That separation matters well beyond Target: a press tally of a ProPublica database counts 343 listed companies reporting $28.5 billion of refunds received or expected.
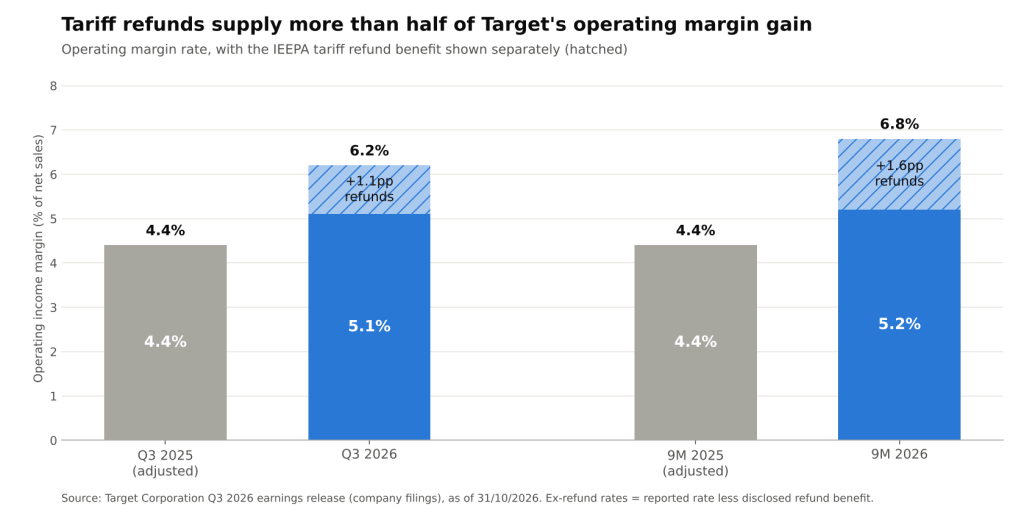
Target operating income margin, with the IEEPA tariff refund benefit shown separately (Target Q3 2026 earnings release @ 31/10/2026)
Where the Refund Sits in the P&L
In the quarter ended October 31, Target recognized $301 million of pretax tariff refunds, worth $228 million after tax and $0.50 of the $2.65 of diluted EPS. Over nine months the benefit totals roughly $1.3 billion. Because the refund is booked inside cost of sales rather than as a separately labeled gain, it does not appear as a non-GAAP adjustment: GAAP and adjusted EPS are identical at $2.65. The refund is in both.
Stripping it out using the company’s own disclosures gives a cleaner picture of the quarter:
- Operating income: $1,672 million reported, or about $1,371 million excluding refunds. Against last year’s adjusted $1,109 million, growth drops from 50.8% to 23.6%.
- EPS: $2.65 reported versus about $2.15 ex-refunds, i.e. growth of 48.9% over last year’s adjusted $1.78 shrinks to 20.8%, in line with the roughly 21% the company itself cites.
- Refund share of profit: the refund equals 18.0% of third-quarter operating income and 24.2% of nine-month operating income.
None of this makes the quarter weak. A business growing underlying operating income by more than a fifth while traffic rises 5.0% is genuinely improving. The point is that the headline figures roughly double the measured pace of that improvement.
Decomposing the Margin Gain
The operating margin rate rose from an adjusted 4.4% to 6.2%, a gain of 1.8pp. The company attributes 1.1pp of that to refunds, leaving about 0.7pp of operating progress. That residual can be rebuilt from the reported line items:
- Gross margin: 30.5% reported against 28.2% a year earlier. Ex-refunds, the rate expanded about 1.2pp to roughly 29.4%, helped by easier comparisons against last year’s heavy markdowns and tariff costs, growing non-merchandise revenue and supply chain productivity.
- SG&A: the expense rate was 21.9%, up from an adjusted 21.3%, a drag of 0.6pp from incentive pay, extra store hours and store investment.
- Depreciation and amortization: 2.5% of sales versus 2.6%, a small 0.1pp tailwind.
The arithmetic closes: 1.2pp less 0.6pp plus 0.1pp equals the 0.7pp ex-refund gain. Over nine months the pattern is starker. Reported operating margin of 6.8% includes 1.6pp of refunds, so the underlying rate is about 5.2%, versus an adjusted 4.4% a year earlier. Refunds account for roughly two-thirds of the 2.4pp reported improvement.
The ROIC Effect
ROIC is the metric most exposed, because it is a ratio of after-tax operating profit to a slow-moving capital base (average invested capital was $32.5 billion). Any one-off gain in the numerator passes almost entirely into the return. Target’s footnote quantifies it: refunds added 3.0pp to trailing ROIC, while business transformation costs subtracted 0.2pp. The prior-year figure carried its own distortion, with interchange fee settlement gains net of transformation costs adding 1.0pp.
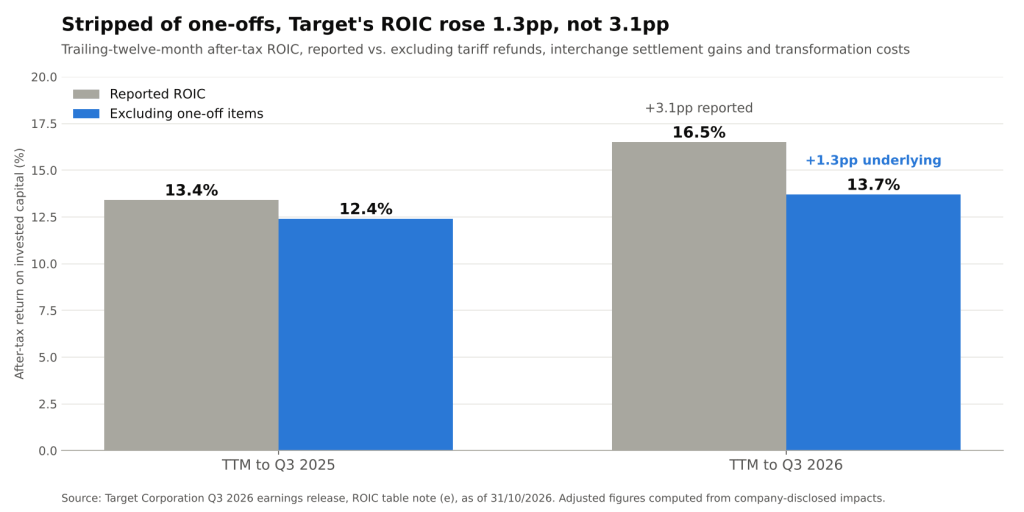
Target trailing after-tax ROIC, reported vs. excluding disclosed one-off items (Target Q3 2026 earnings release @ 31/10/2026)
Removing those items on the company’s disclosed impacts, underlying ROIC moved from about 12.4% to about 13.7%, an improvement of 1.3pp rather than the reported 3.1pp. Two implications follow for anyone using ROIC in a valuation framework:
- Spread over WACC: economic profit models (ROIC minus the cost of capital, multiplied by invested capital) should start from the underlying return. Using 16.5% would overstate the value-creation spread by roughly 3pp.
- Incremental returns: Target spent $3.8 billion on capex in nine months and plans $5 billion to $6 billion in 2027, justified by strong returns on 2026 investment. Judging those returns against a refund-inflated base would flatter them.
Guidance and Cash: The Same Lens
Management raised full-year EPS guidance to $10.65–$11.40, which includes about $2.14 of refund benefits recognized to date and excludes any future refunds. The ex-refund range is therefore roughly $8.51–$9.26. Likewise, the full-year operating margin guide of around 6.2% includes about 1.1pp of refunds, implying an underlying rate near 5.1%. At the midpoint, refunds make up about 19% of guided EPS.
Cash flow tells a similar story. Nine-month operating cash flow was $5.7 billion and capex $3.8 billion, leaving free cash flow (i.e. operating cash flow minus capex) of about $2.0 billion, versus about $0.6 billion a year earlier. The pretax refund benefit of roughly $1.3 billion is equivalent to about two-thirds of that free cash flow. A larger payables balance also helped finance a seasonal inventory build, but the refund was a major contributor to the year-over-year improvement in cash generation.
This creates a base-effect problem for 2027. Next year’s comparisons will be made against quarters that contain refunds. Unless reported figures are normalized, the eventual absence of refunds will register as margin compression, even if the underlying business keeps improving. The ProPublica tally adds a second question across the sector: with around $166 billion of tariffs subject to repayment, many retailers, carriers and manufacturers face the same flattering 2026 and harder 2027 comparison.
Conclusion
Target’s third quarter shows real operating progress: traffic-driven sales growth, about 1.2pp of underlying gross margin expansion and roughly 21% underlying EPS growth. But the tariff refunds booked through cost of sales roughly double the apparent pace of improvement in operating income, supply about two-thirds of the nine-month margin gain and add 3.0pp to the 16.5% ROIC. The underlying return is closer to 13.7%.
What to watch next: whether further refunds arrive in the fourth quarter (they are excluded from guidance), how Target presents 2027 comparisons against refund-boosted quarters, whether SG&A deleverage persists as investment rises, and how other refund recipients disclose the effect. Normalizing for refunds is likely to be a standard adjustment in retail analysis through next year.
Sources: Target Corporation, Third Quarter 2026 earnings release (18/11/2026); International Business Times via Yahoo Finance, ProPublica tariff refund database coverage (20/11/2026).
Daniel Panizo, CFA, FMVA



Leave a Reply